SIPOC Diagram Template for PowerPoint & Google Slides
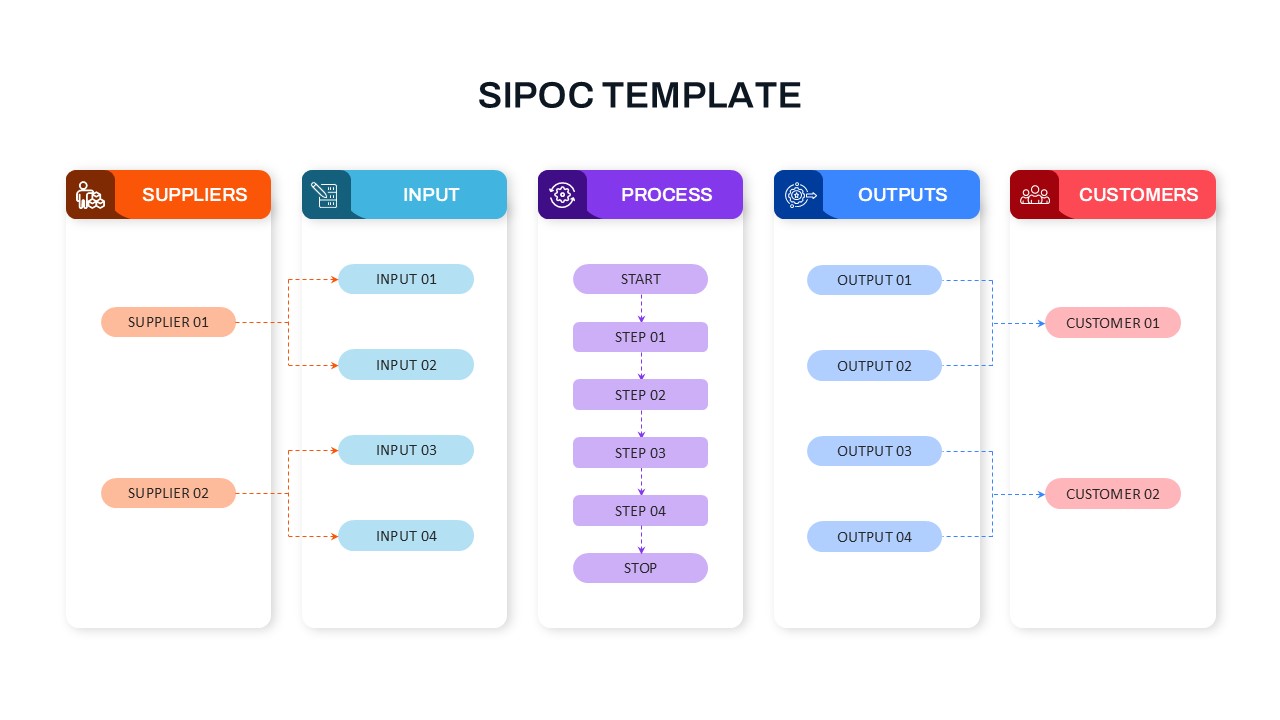
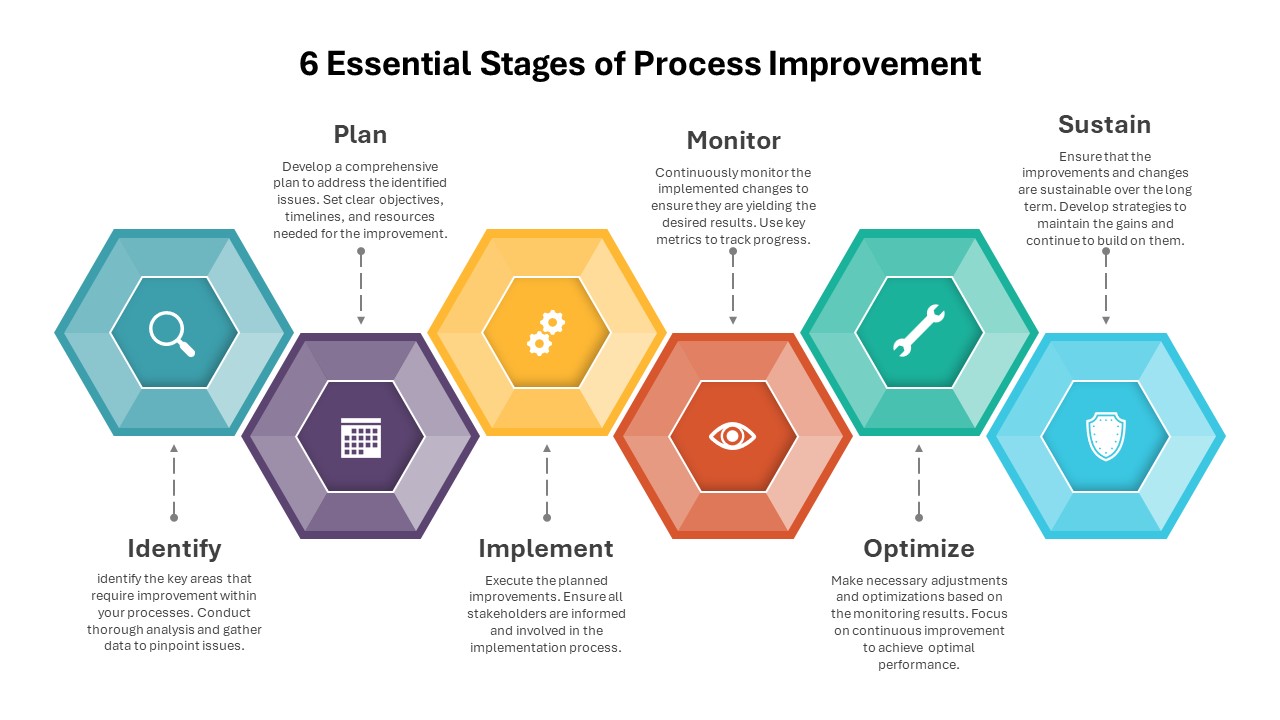
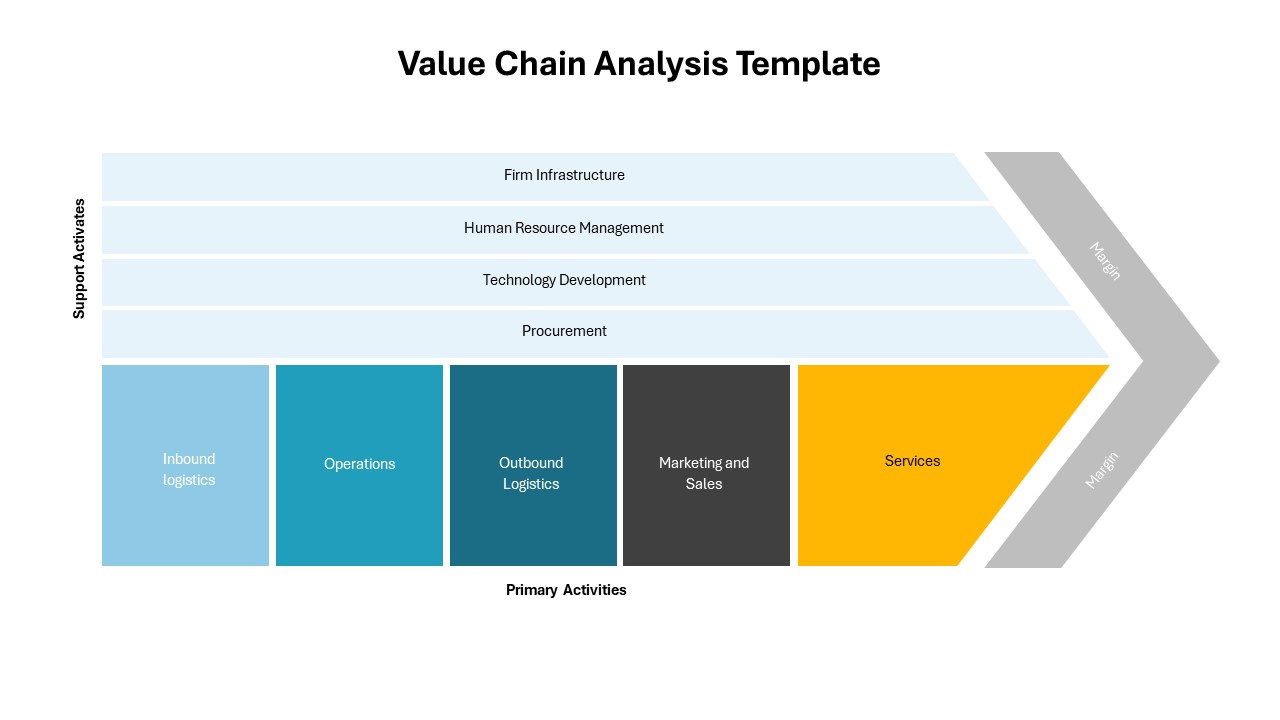
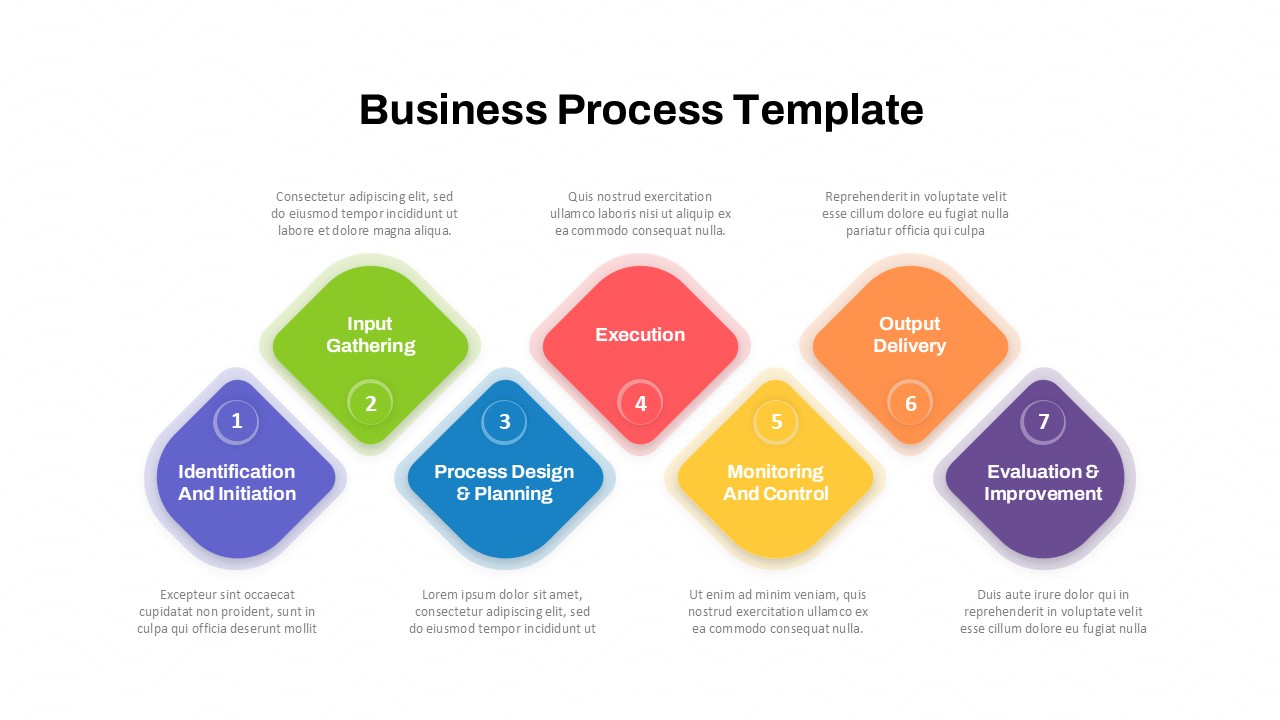
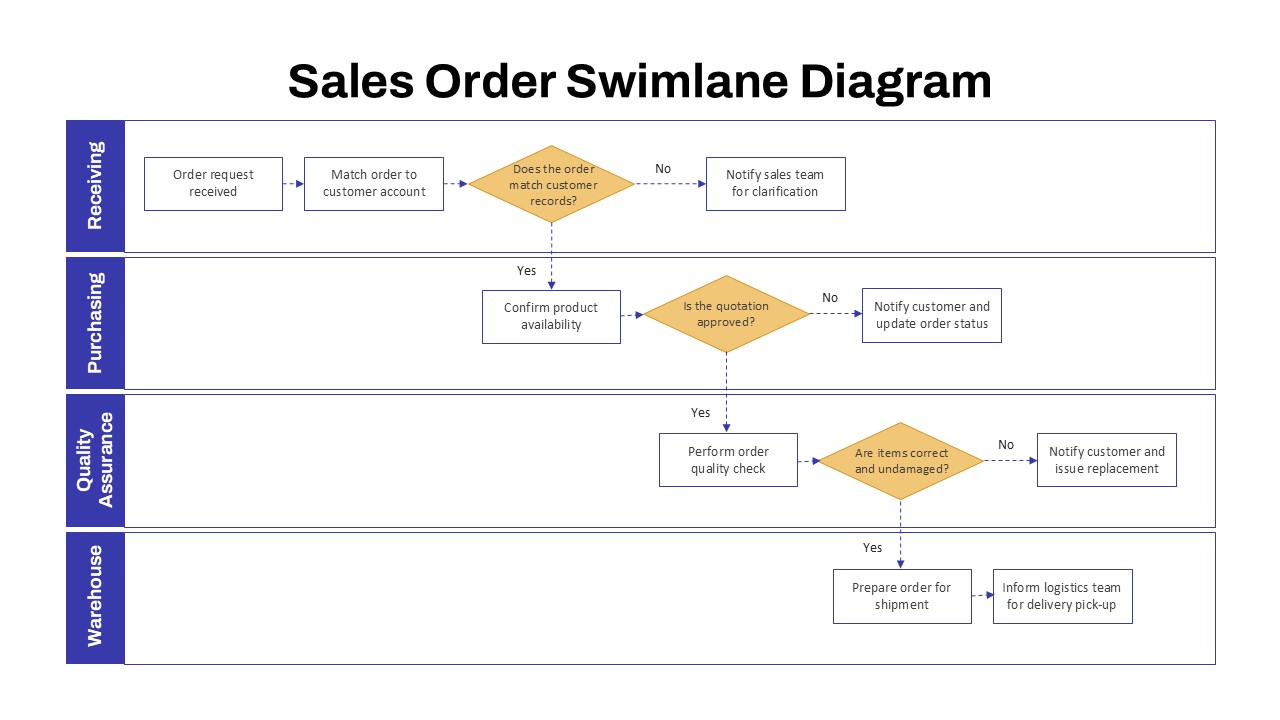
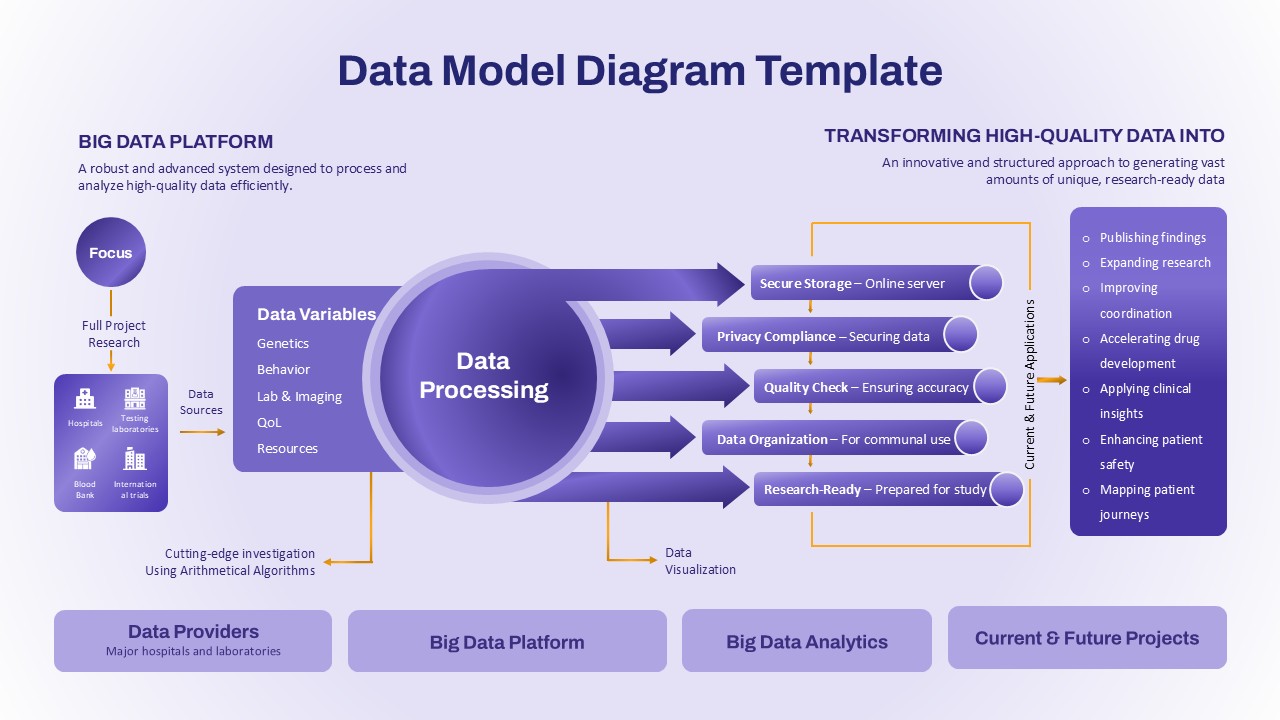
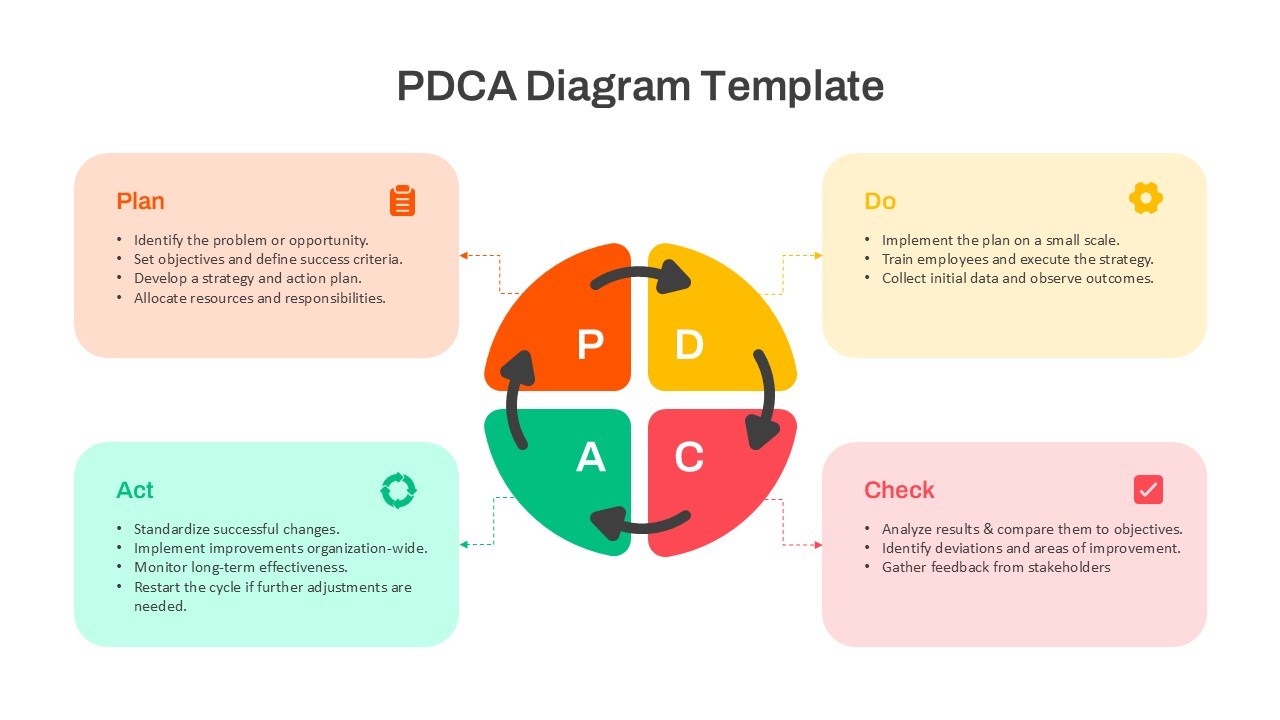
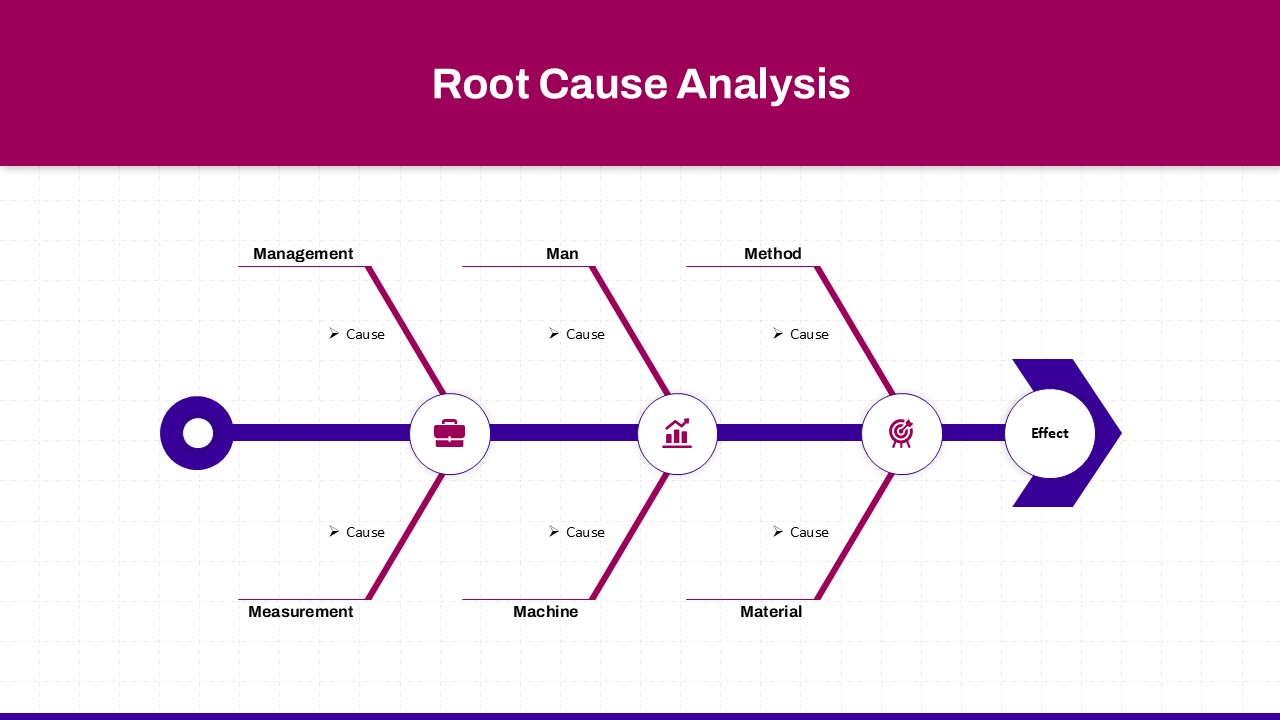
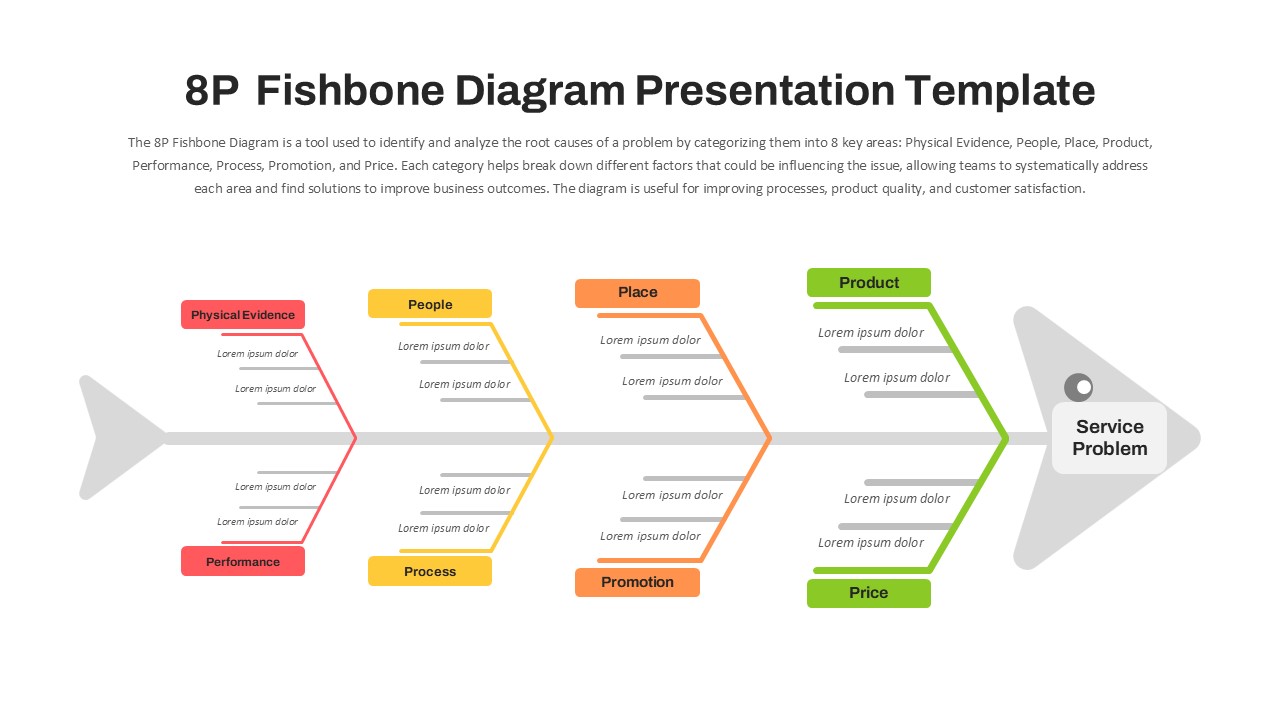
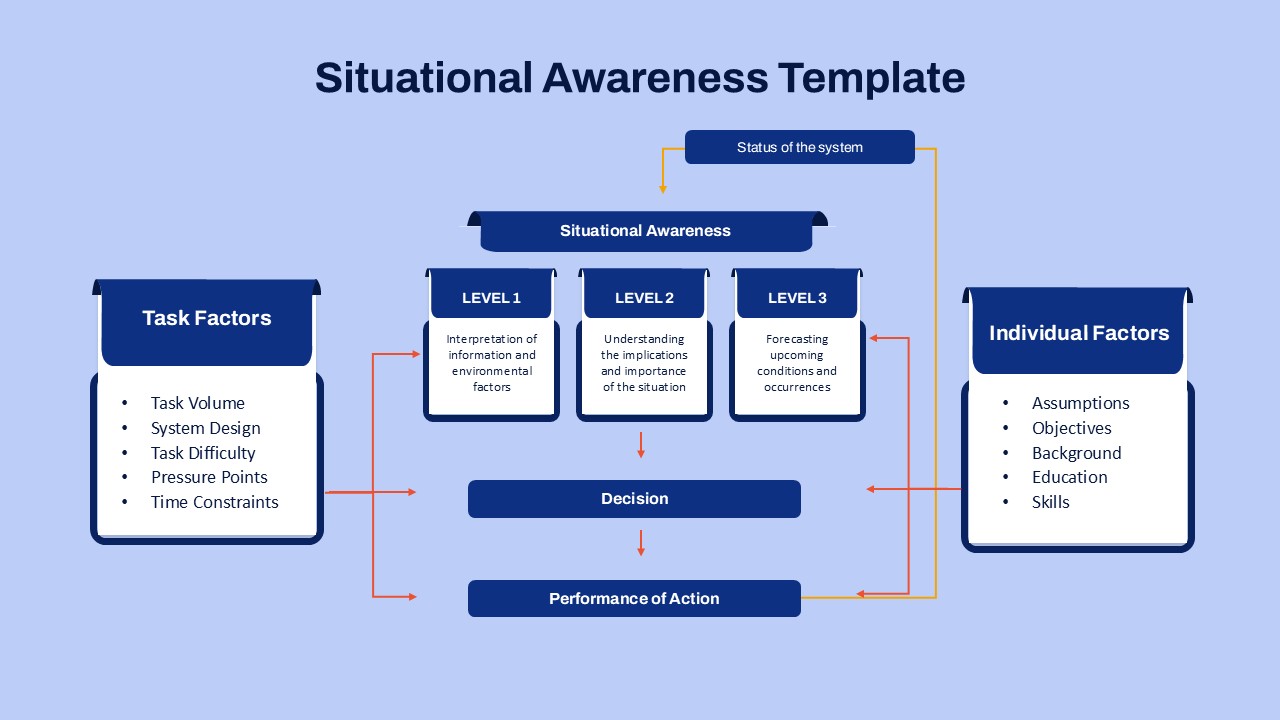
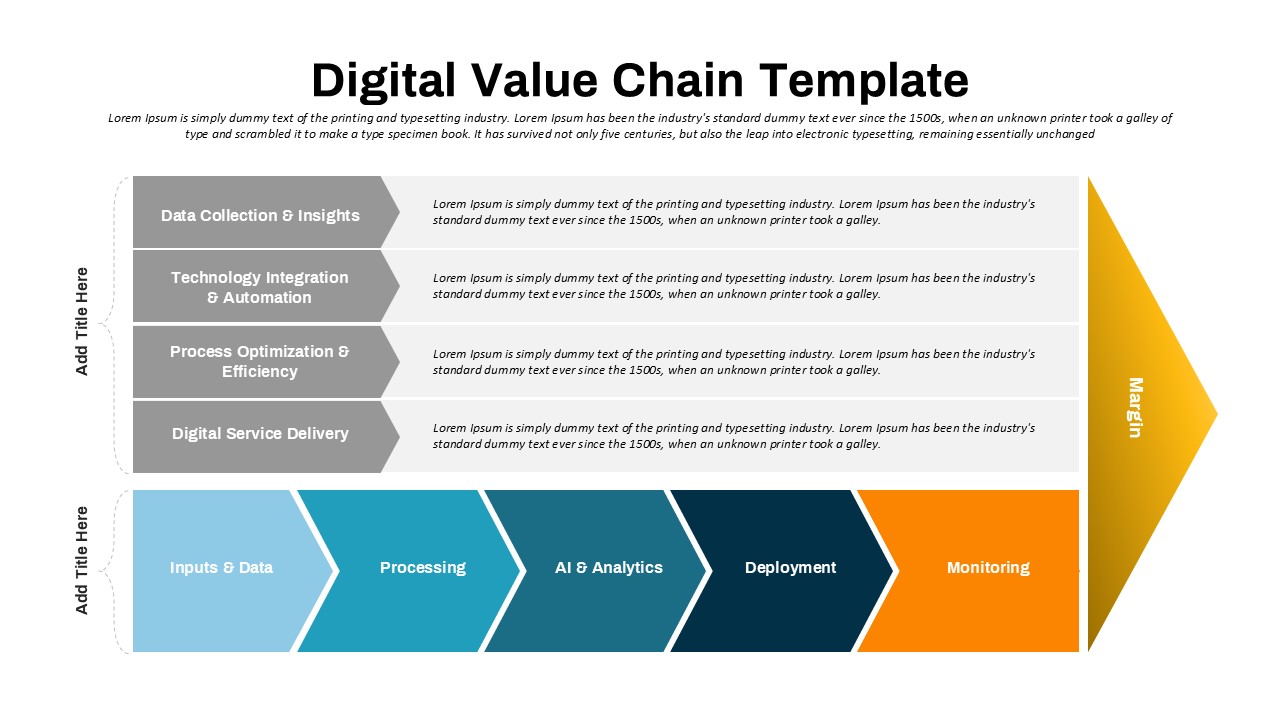
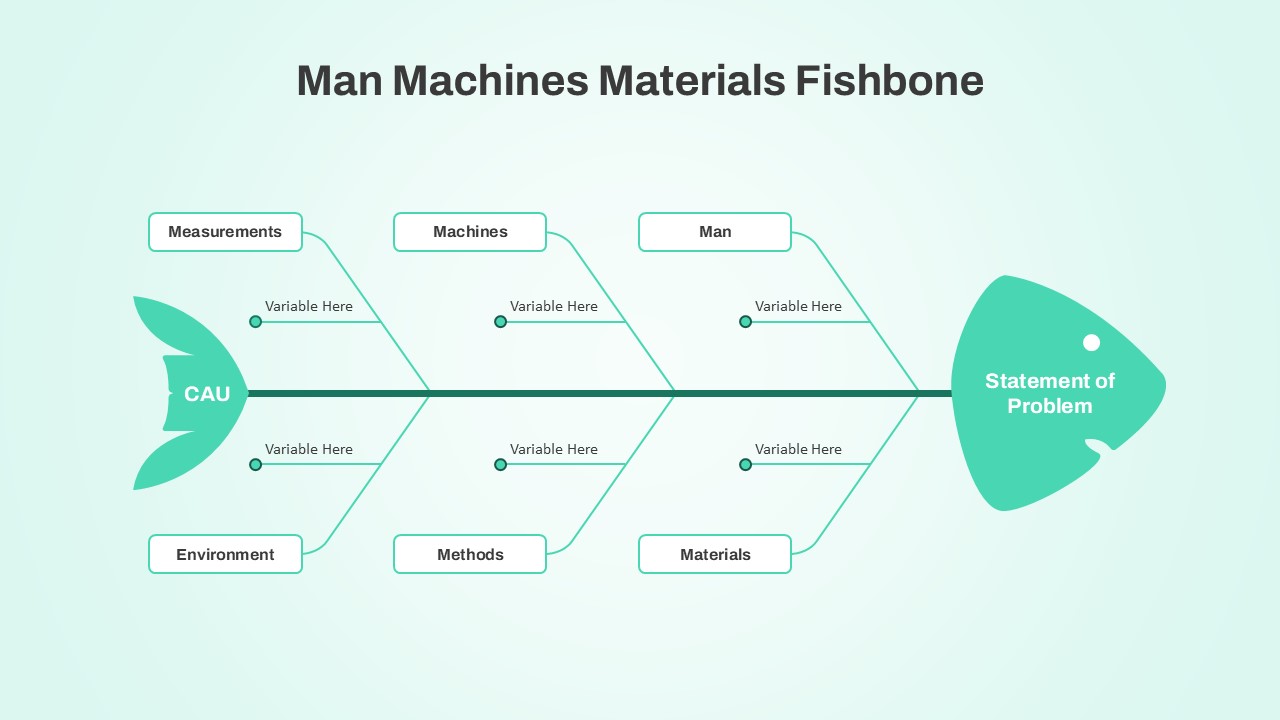
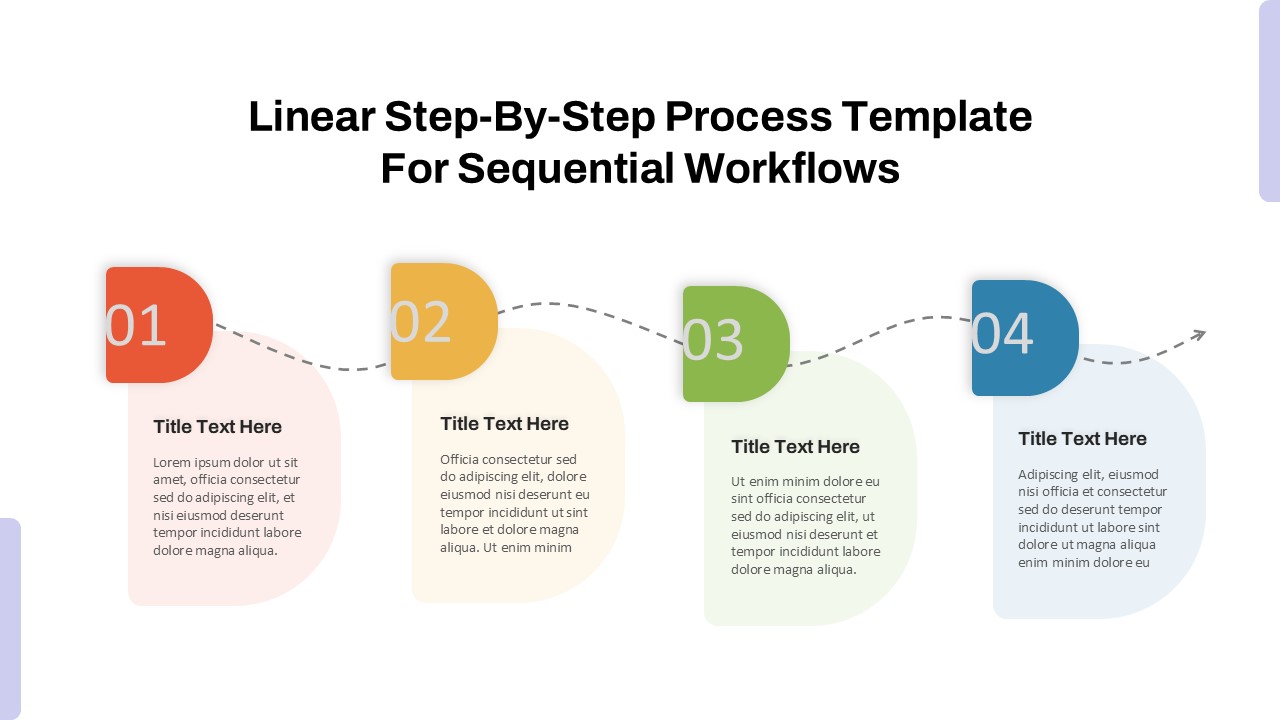
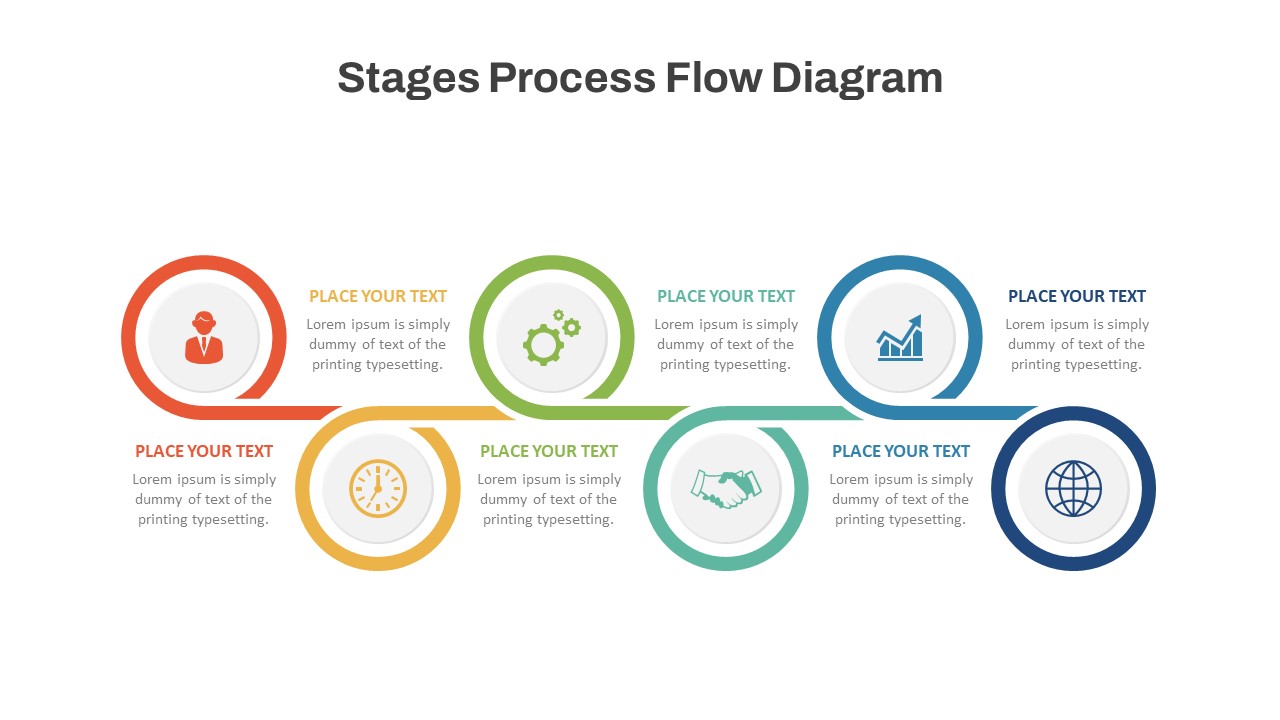
The SIPOC Diagram Template is an essential tool for visualizing and understanding business processes. It is widely used in process improvement methodologies like Six Sigma and Lean to map out the Suppliers, Inputs, Process, Outputs, and Customers involved in any workflow or production cycle. This template provides a simple and effective way to capture high-level process flows, ensuring that all key elements of a business process are considered and analyzed.
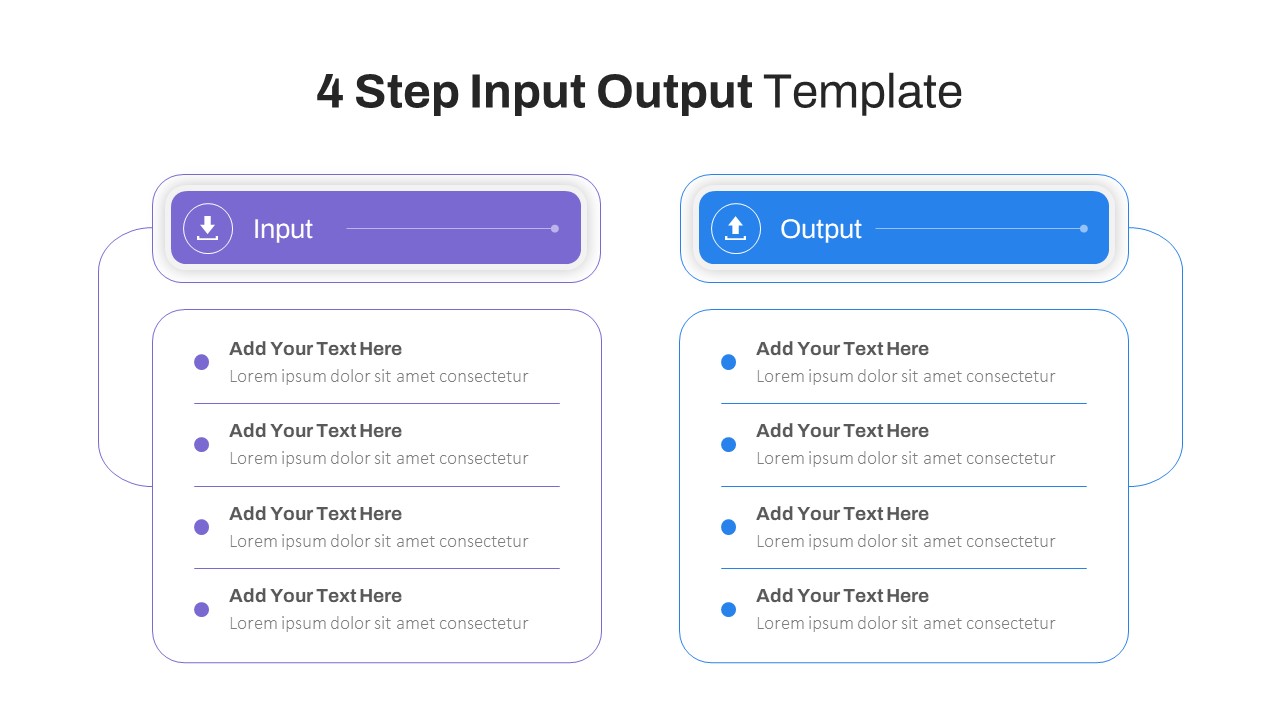
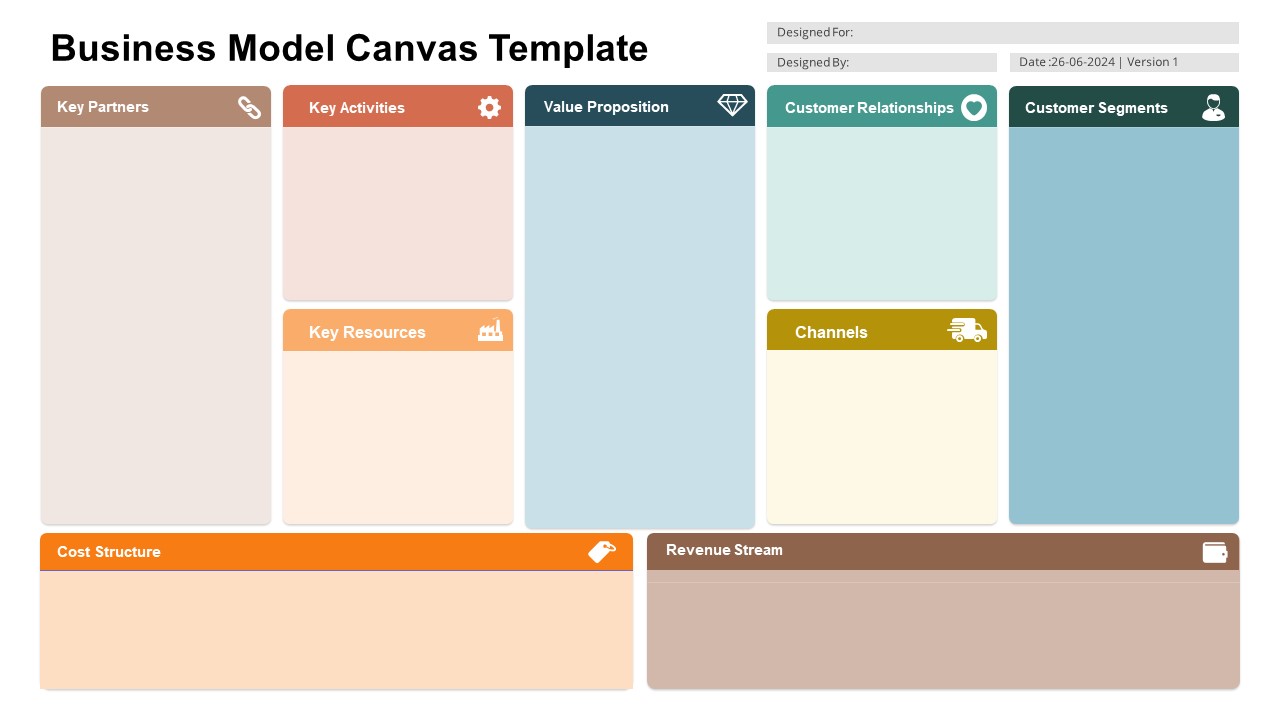
With this editable powerpoint sipoc template, you can break down a process into its fundamental components, making it easier to identify areas for improvement and ensure alignment across teams. The layout includes distinct sections for Suppliers, Inputs, Process Steps, Outputs, and Customers, allowing users to quickly fill in relevant information for process mapping and analysis.
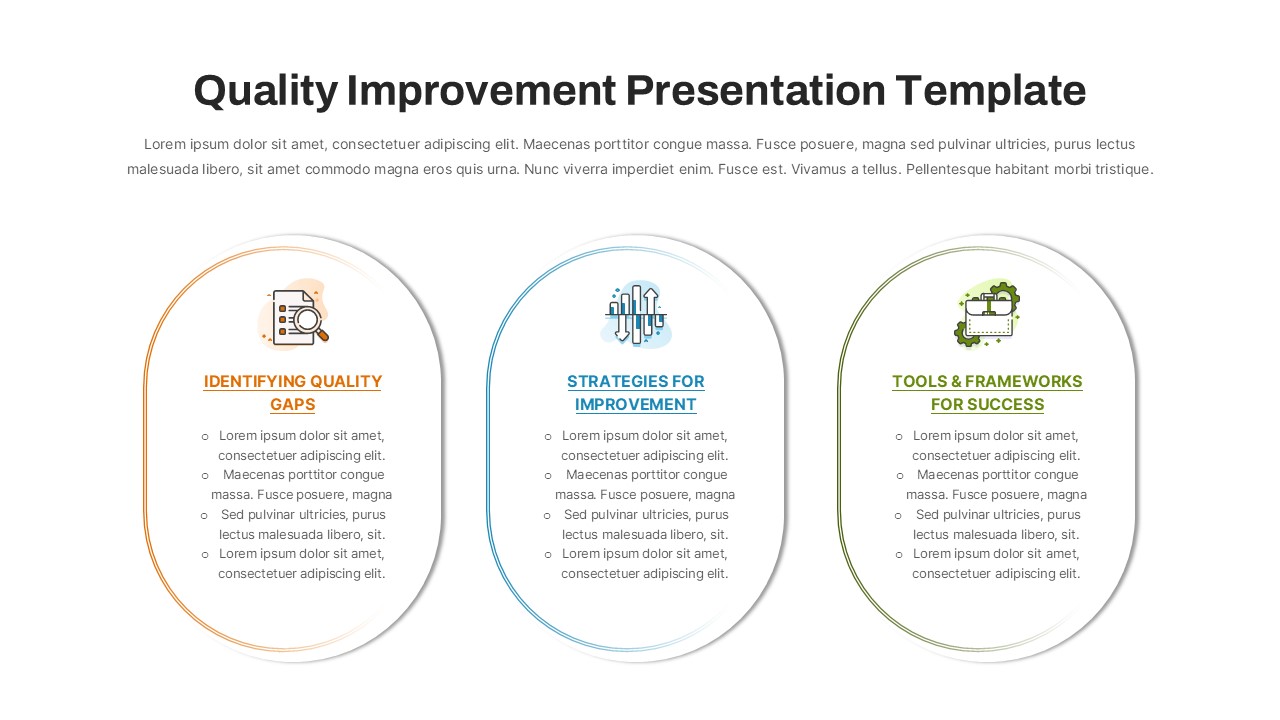
Whether you’re involved in quality management, business analysis, or operational optimization, this template helps streamline process documentation and fosters effective communication. Perfect for process managers, quality analysts, and team leads, this SIPOC diagram helps ensure that all critical steps and stakeholders are clearly defined.
This sipoc chart template is available for both PowerPoint and Google Slides, allowing for easy customization and professional presentation. Use it to analyze workflows, optimize processes, and improve overall business efficiency.
See more

Aspect Ratio
16:9Item ID
SKT03530
Features of this template
Other User Cases of the Template:
process mapping, quality improvement initiatives, business process analysis, operational efficiency optimization, Six Sigma projects, Lean process documentation, supplier and customer analysis, project management
FAQs
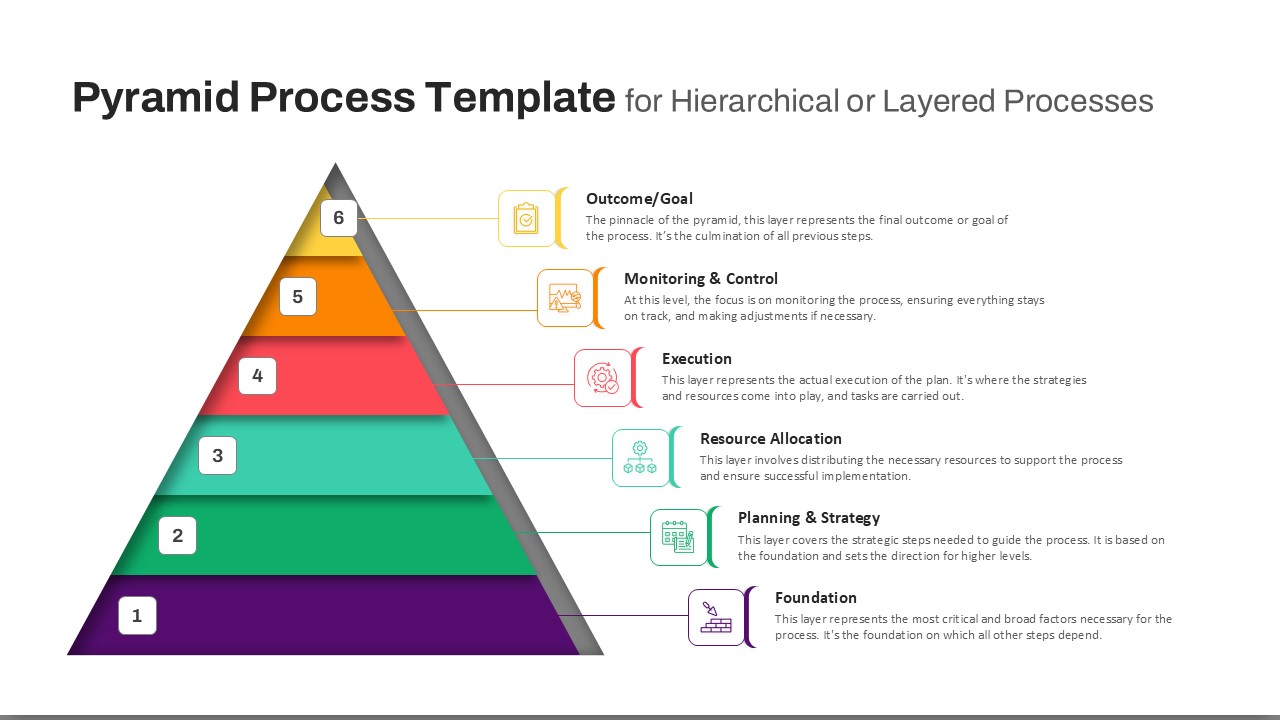
You May Also Like These Presentation Templates

- Free
- Free

- Free