Stock Market Buy Sell Analysis PPT Template & Google Slides

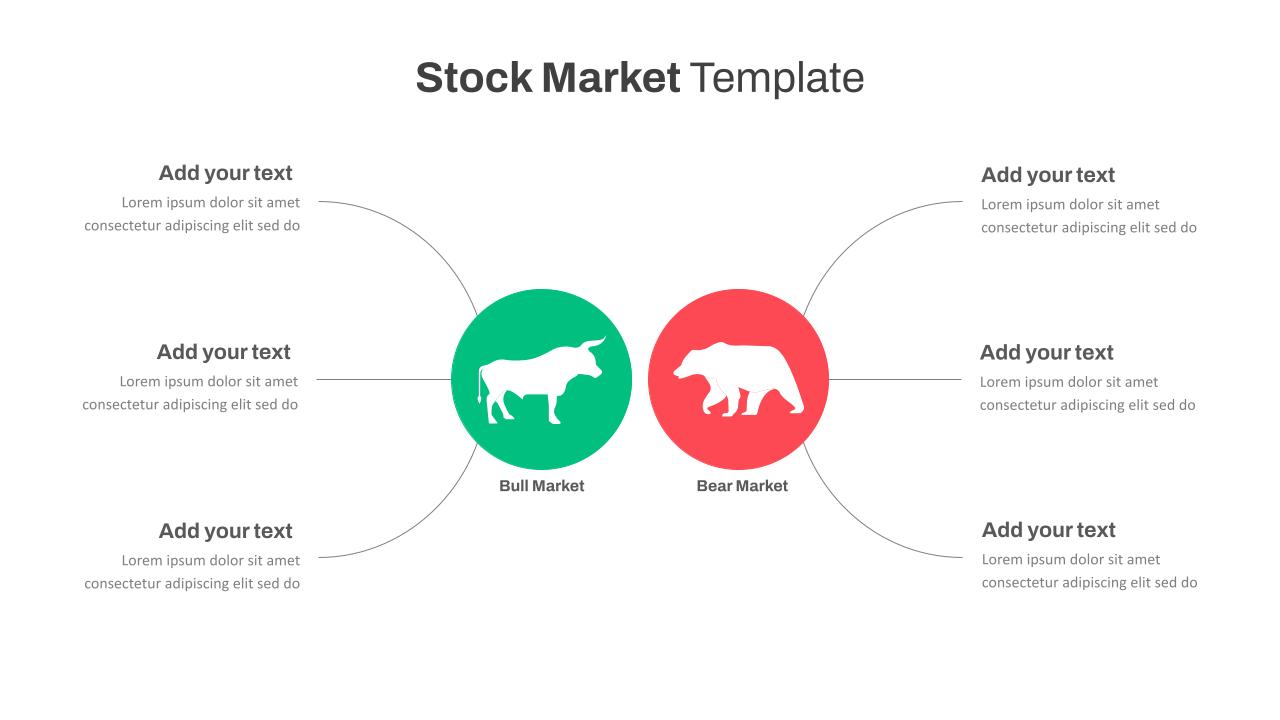
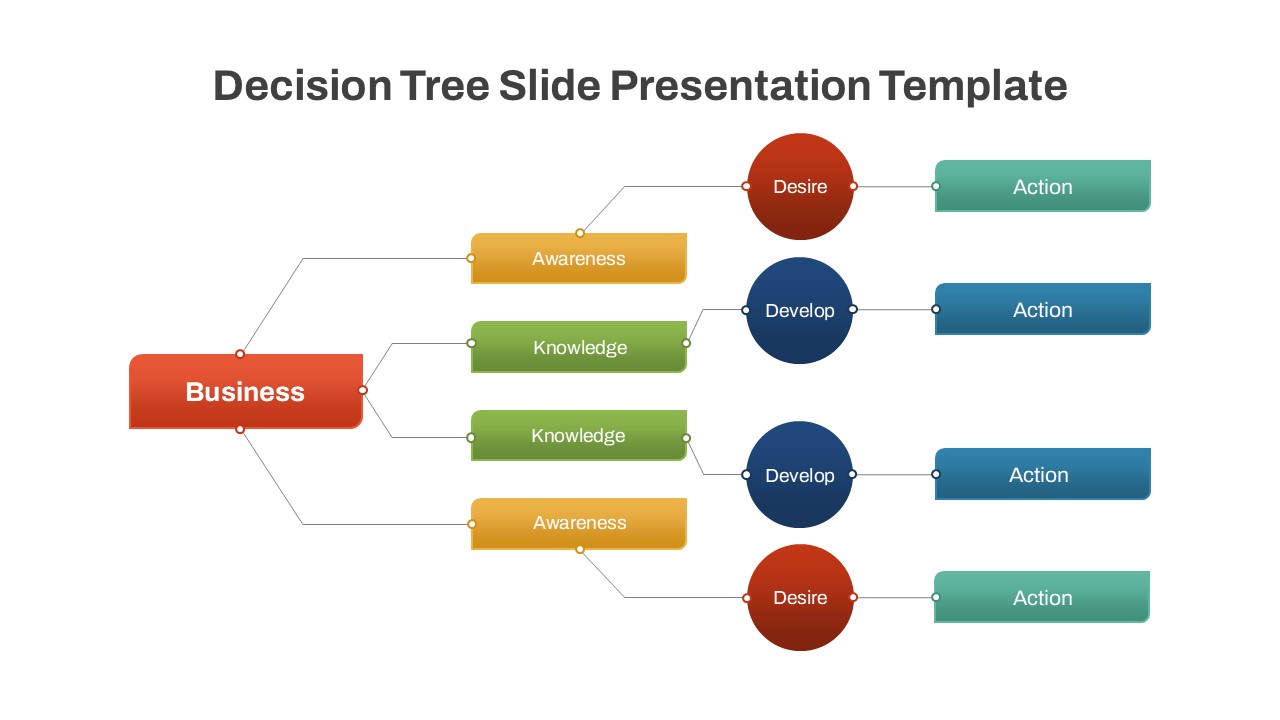
The Stock Market Buy-Sell Analysis Template is a highly effective tool designed for financial analysts, traders, and educators looking to explain the dynamics of the stock market. Featuring a clean, minimalist design, this stock market ppt template visually contrasts the key concepts of buying and selling stocks, alongside the resulting profit and loss outcomes. At the center, a bold “Buy” and “Sell” arrow graphic clearly illustrates the dual nature of stock transactions, while the side columns allow you to detail the potential profits and losses in an organized manner.
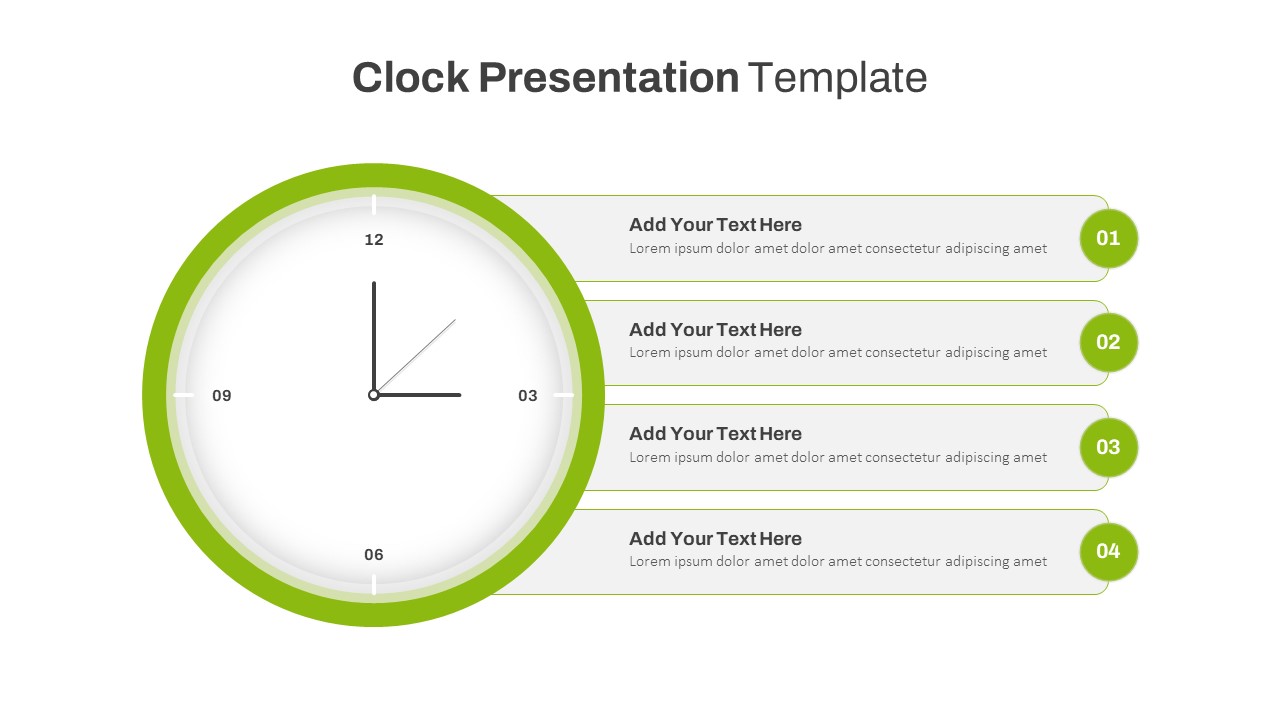
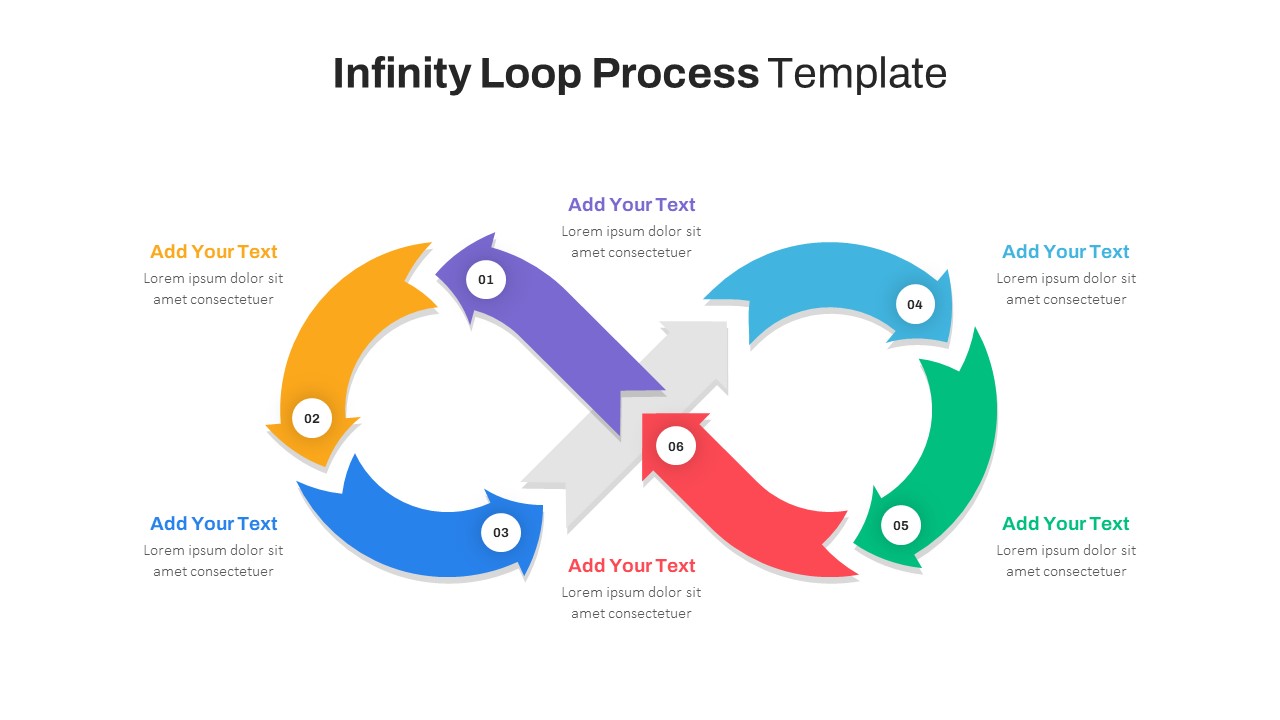
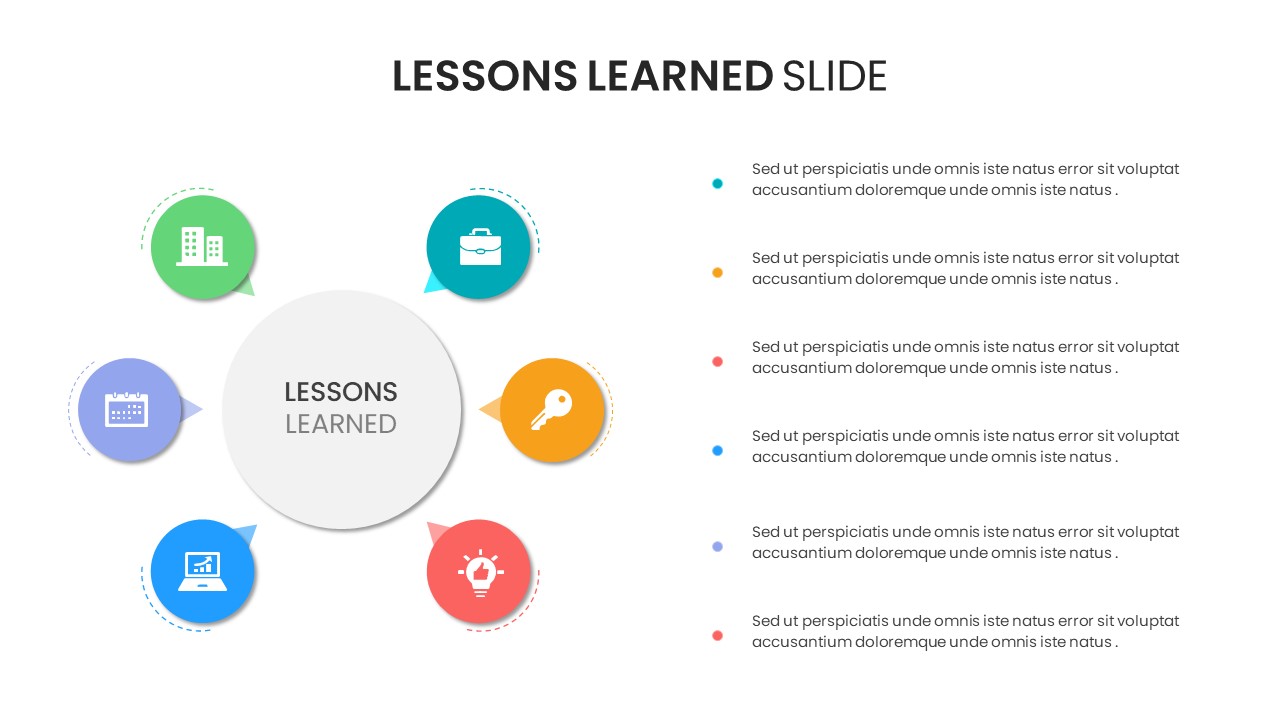
This infographic PowerPoint slide template is ideal for presenting stock market strategies, investment analyses, or financial overviews. It allows you to easily explain complex market concepts to beginners, clients, or teams, offering a straightforward approach to analyzing stock performance. Each section can be customized to include specific data, insights, or stock performance metrics, making it an essential tool for anyone involved in financial presentations.
Tailored for PowerPoint and Google Slides, the template offers full customization of text, colors, and layouts. Whether you’re preparing a financial report, delivering a stock market workshop, or educating students on trading fundamentals, this template offers a professional yet accessible platform to display your content.
See more

Aspect Ratio
16:9Item ID
SKT00939
Features of this template
Other User Cases of the Template:
Investment strategy presentations, stock market training sessions, financial performance reviews, risk management analysis, day trading overviews, profit-loss comparisons, corporate finance reports, portfolio management discussions, market trend analysis, educational workshops on stock trading basics.FAQs
You May Also Like These Presentation Templates

- Free

- Free
- Free
- Free
- Free
- Free
- Free
- Free
- Free
- Free