Suriname Map with Data Visualization Template
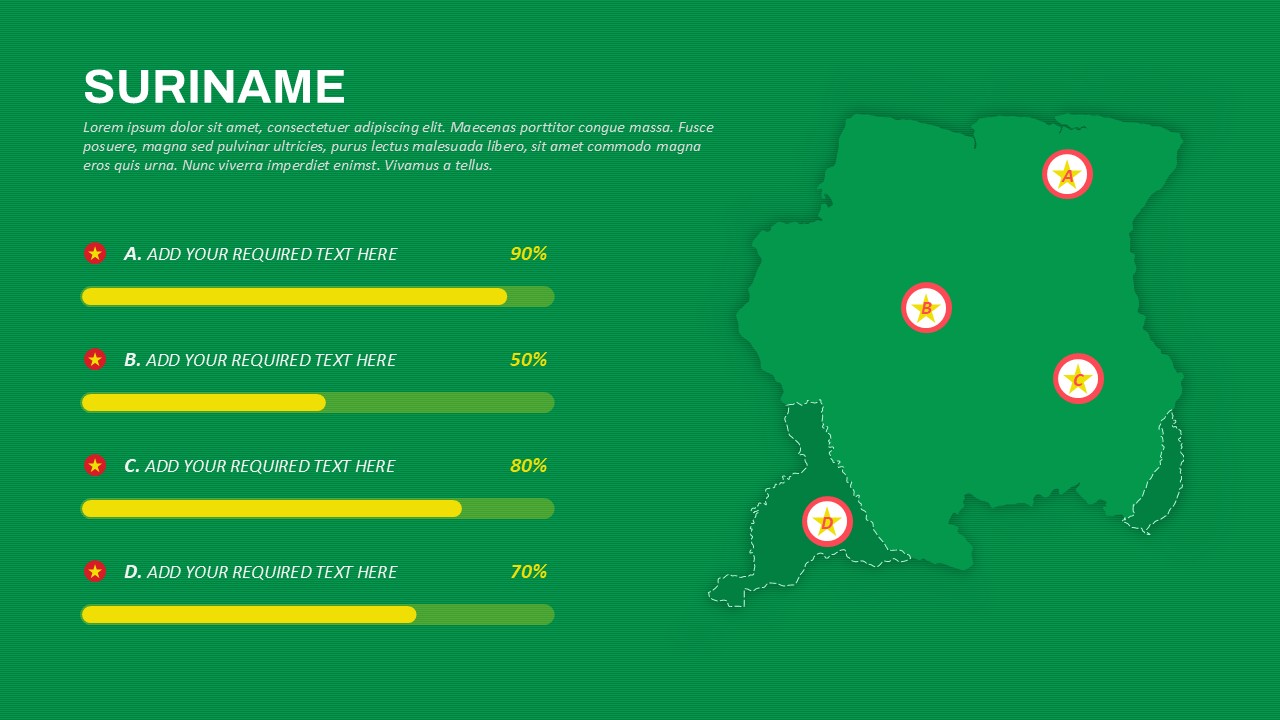
The Suriname Map with Data Visualization PowerPoint Template is an impactful and highly visual presentation tool tailored for displaying regional statistics, performance metrics, or geographic analysis within the context of Suriname. Whether you’re delivering insights on market penetration, project implementation, development indices, or population studies, this template offers a clean and structured layout to communicate your data effectively.
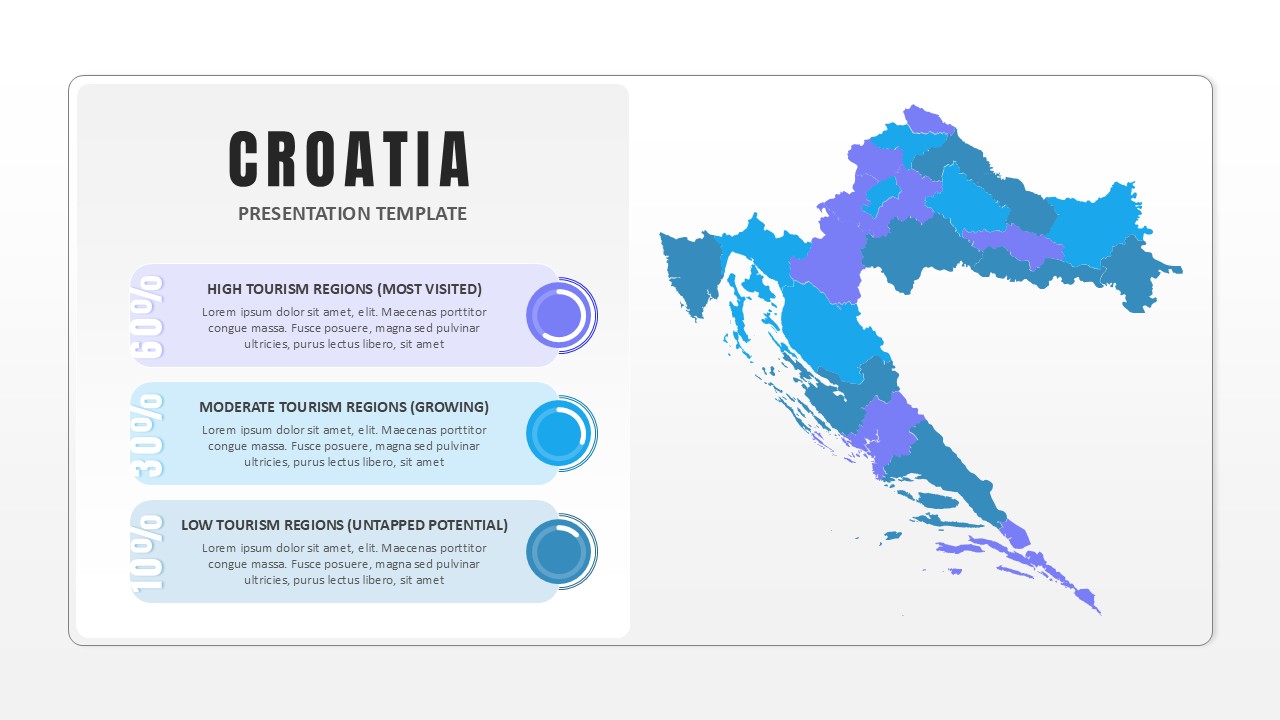
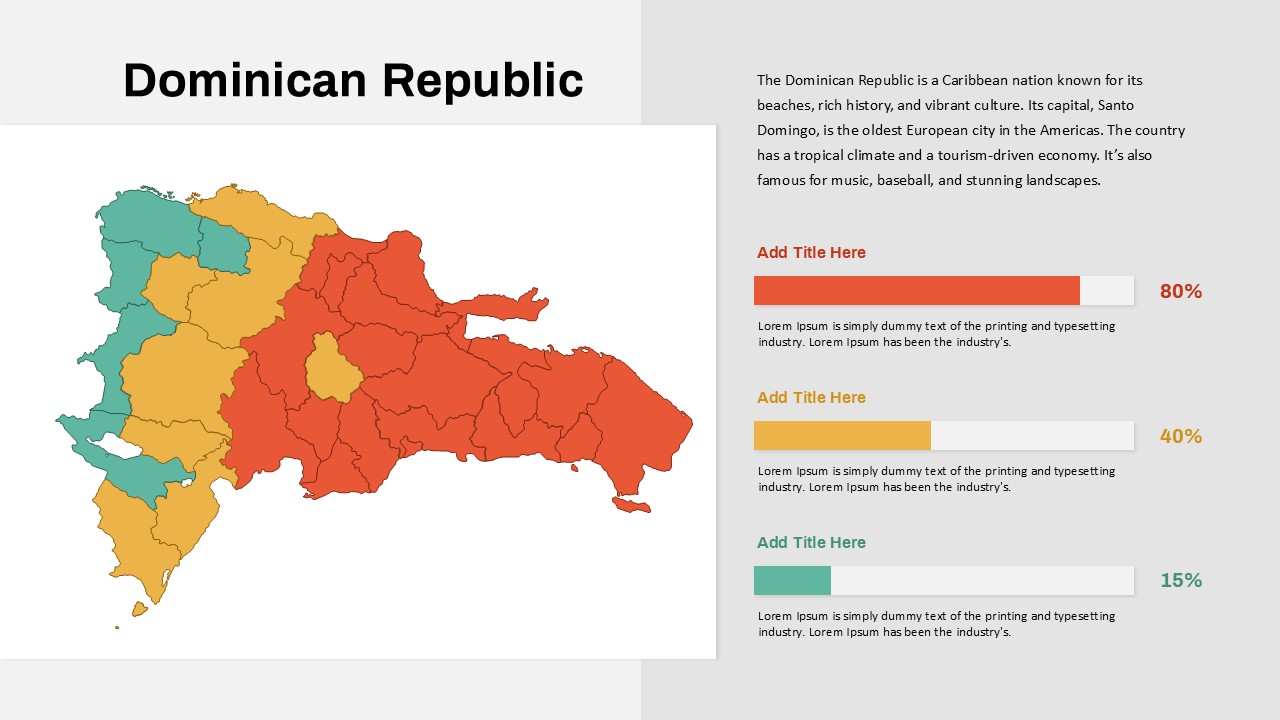
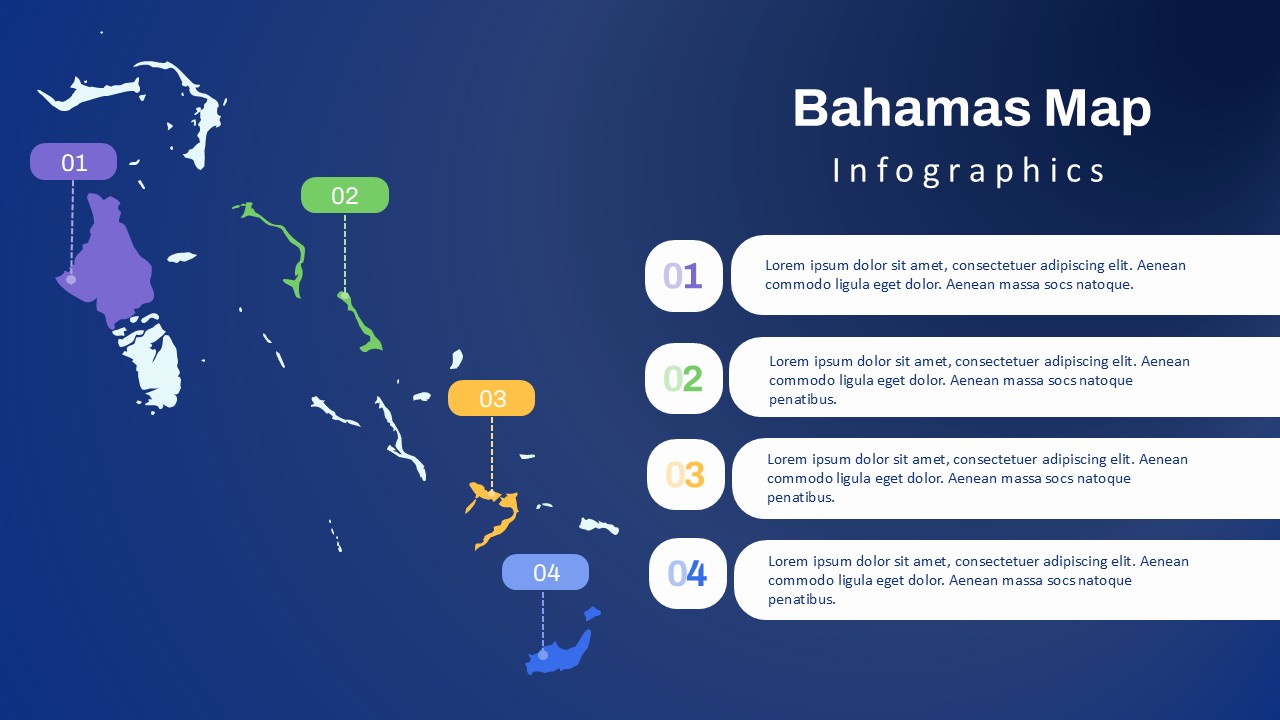
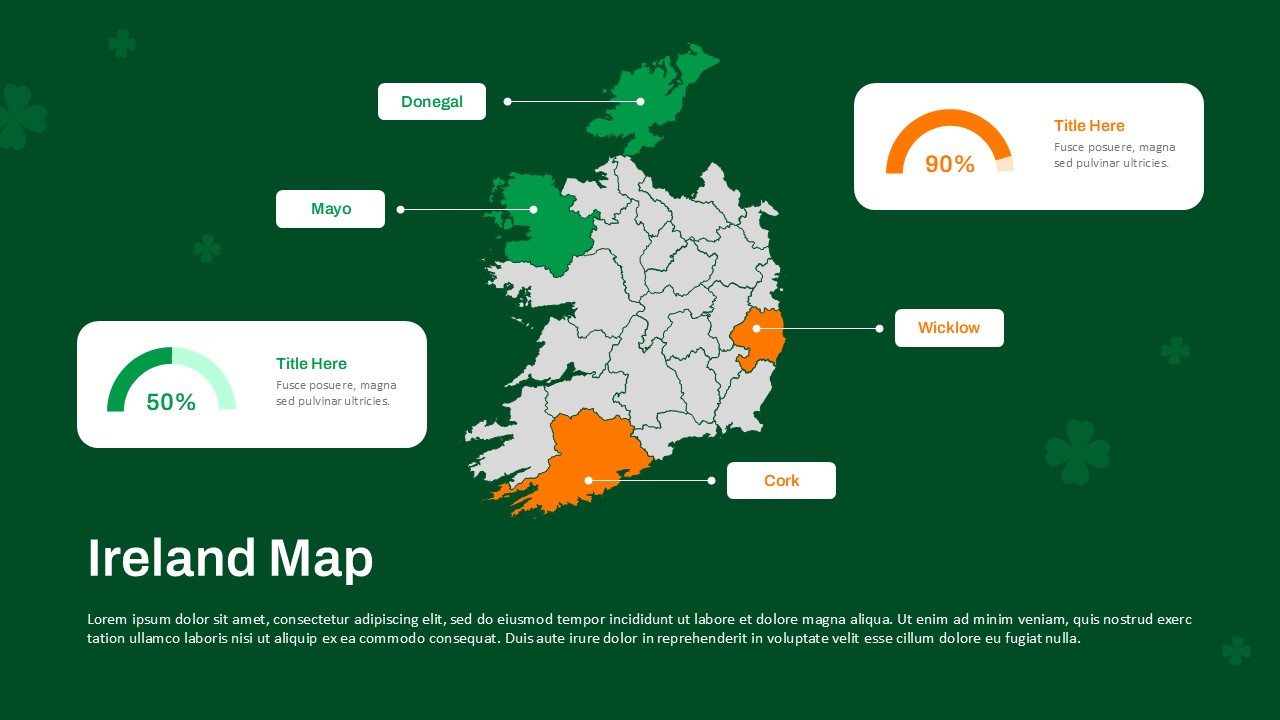
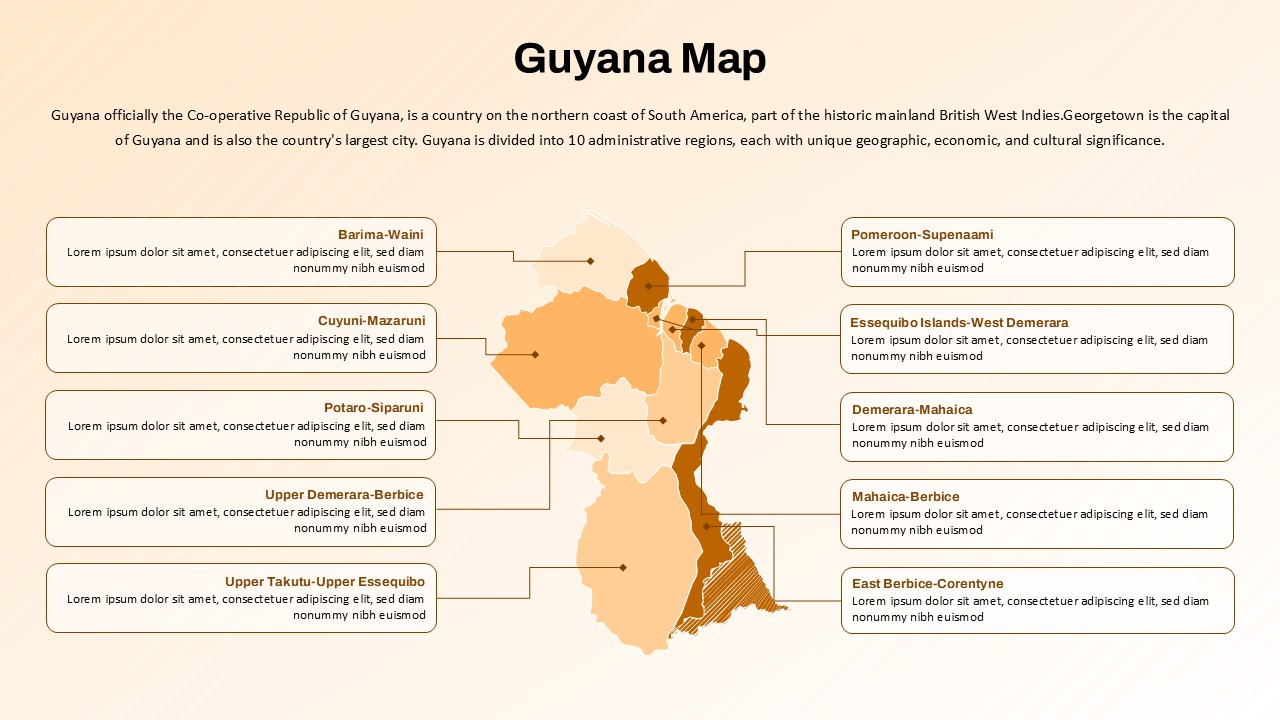
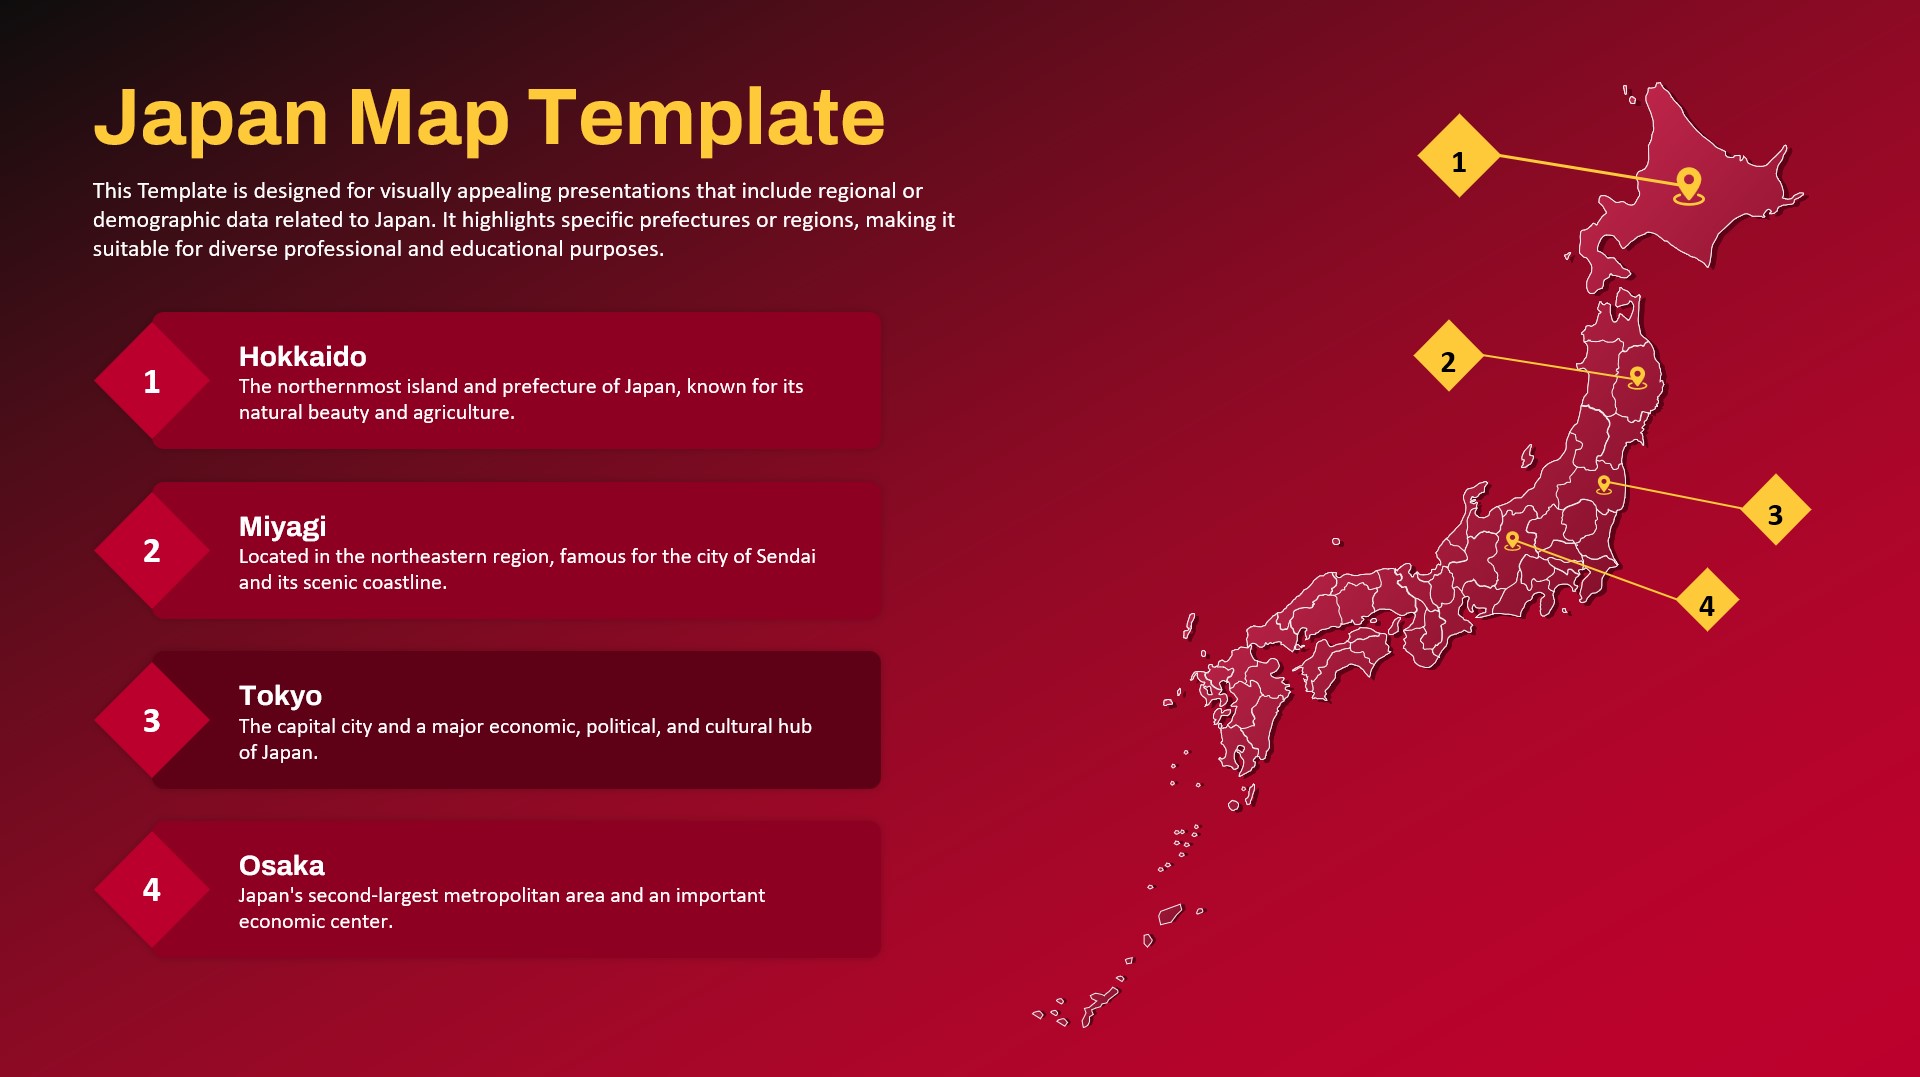
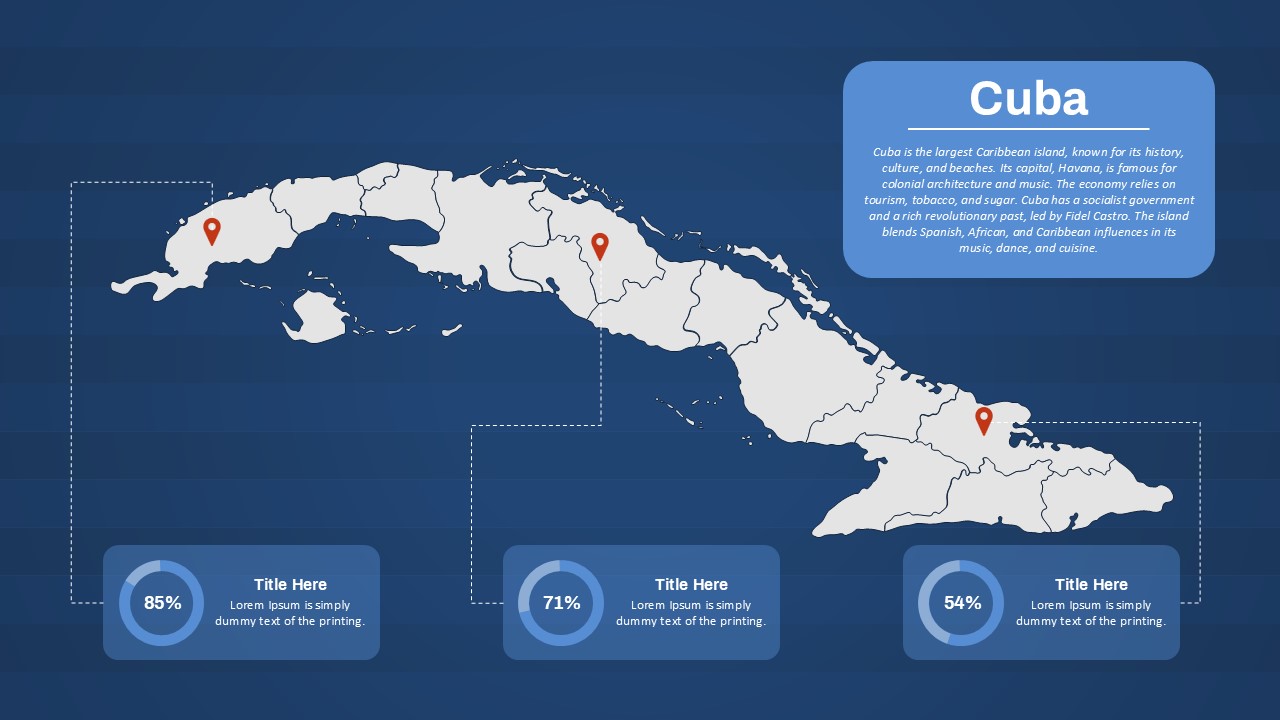
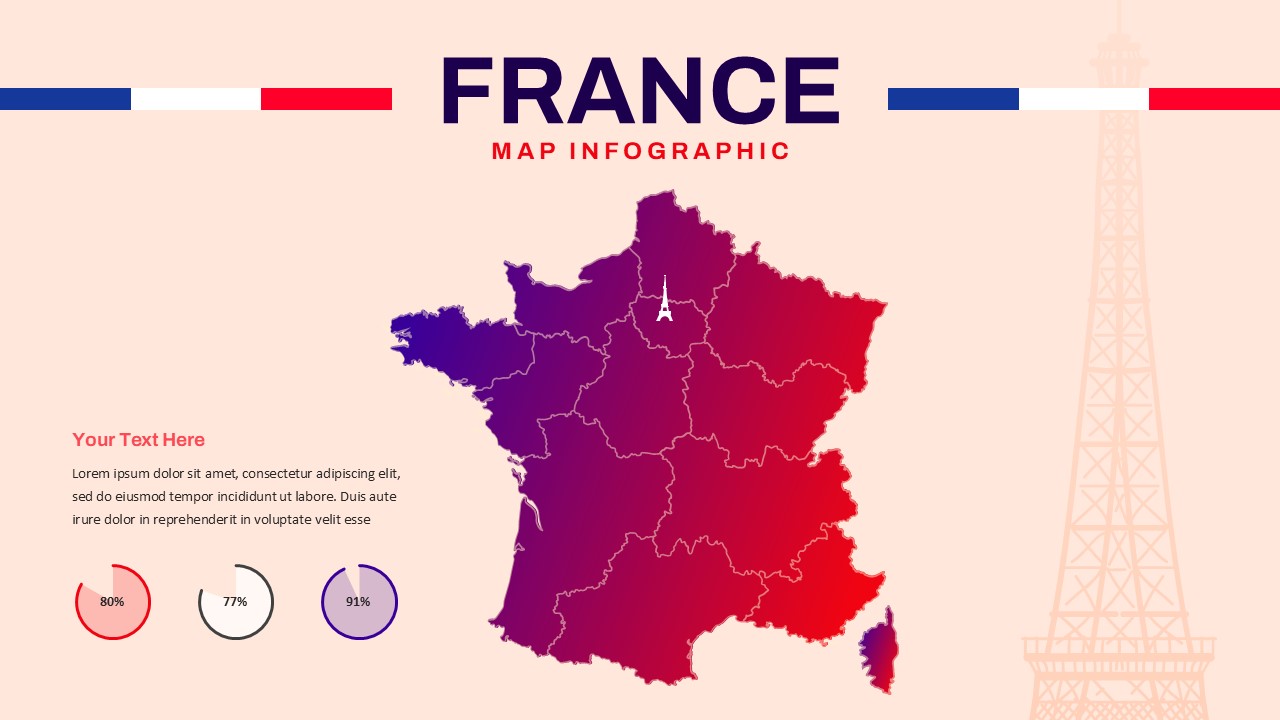
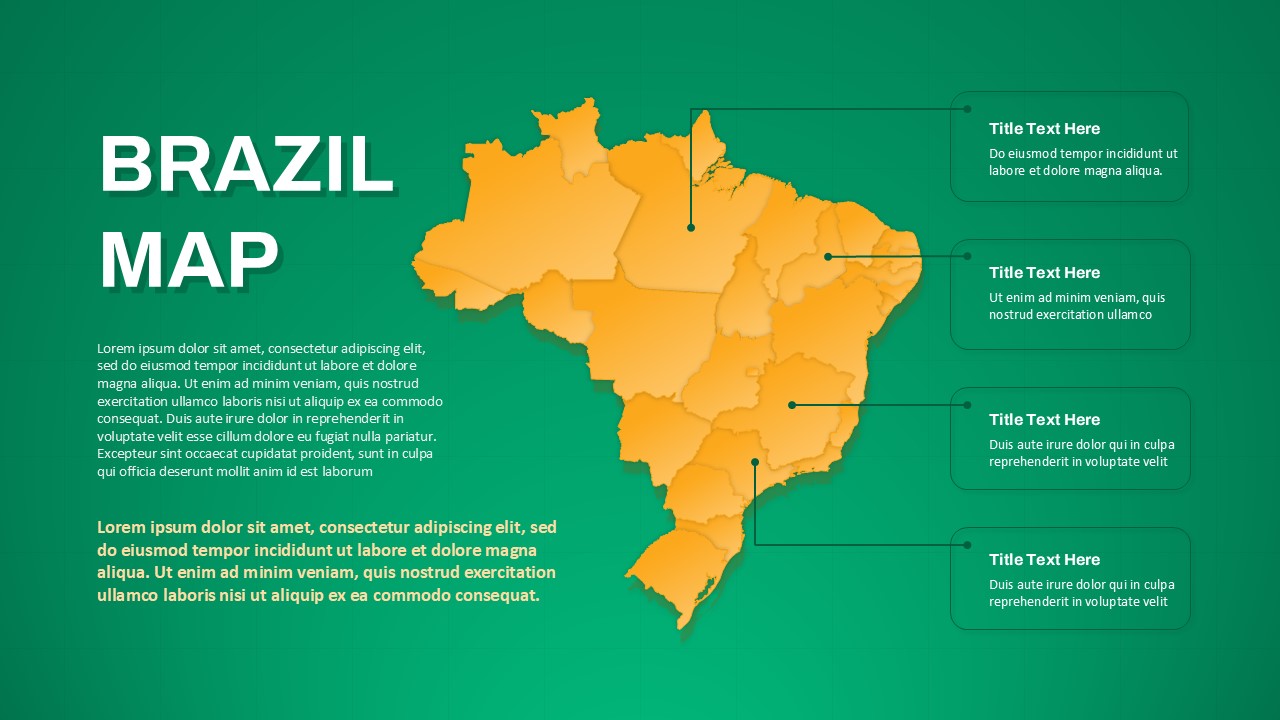
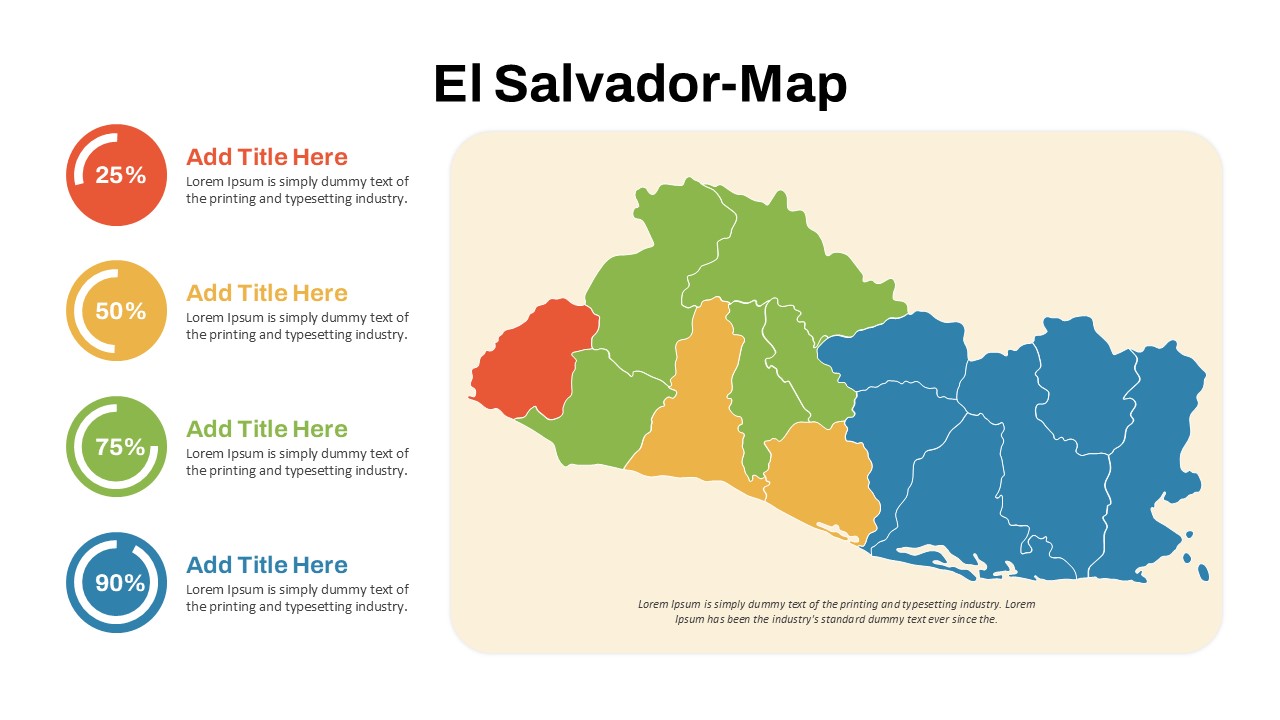
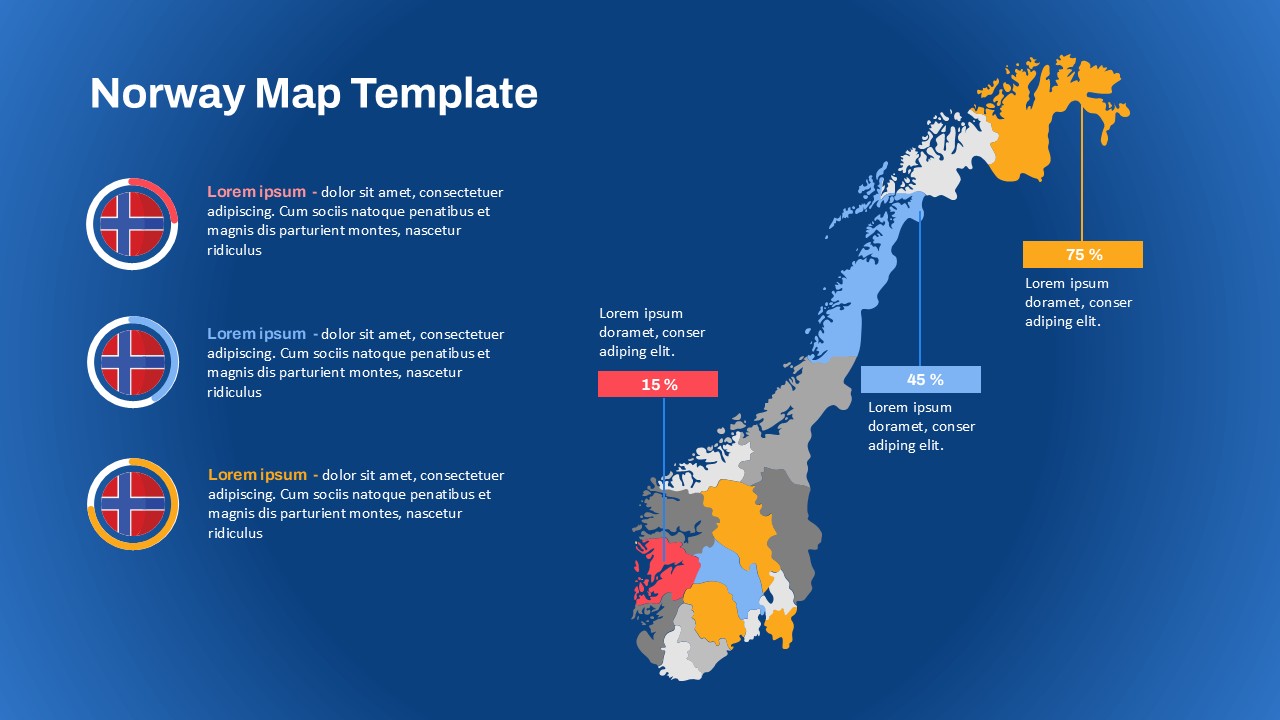
At the heart of the slide is a detailed map of Suriname, segmented with markers labeled A to D, each corresponding to color-coded progress bars that can be customized to represent specific metrics such as coverage, success rate, participation, or distribution. The green theme and star icons—reflective of the national flag’s identity—further reinforce the country-focused narrative and add a professional yet culturally resonant touch.
Ideal for both government and corporate use, this template supports storytelling with visual clarity. The left-aligned data bars are paired with editable text boxes, allowing presenters to add context or key performance highlights, while the right-aligned map keeps geographical relevance at the forefront.
Designed for PowerPoint and Google Slides, this fully editable template is great for decision-making presentations, field reports, regional comparisons, and demographic research. It saves time while elevating the quality of communication through visually engaging, easy-to-read elements.
See more

Aspect Ratio
16:9Item ID
SKT03370
Features of this template
Other User Cases of the Template:
Regional performance analysis, demographic studies, market expansion reports, governmental briefings, NGO impact tracking, academic research, tourism insights, population distribution visualization, survey result presentations, cross-regional comparison decks.
FAQs
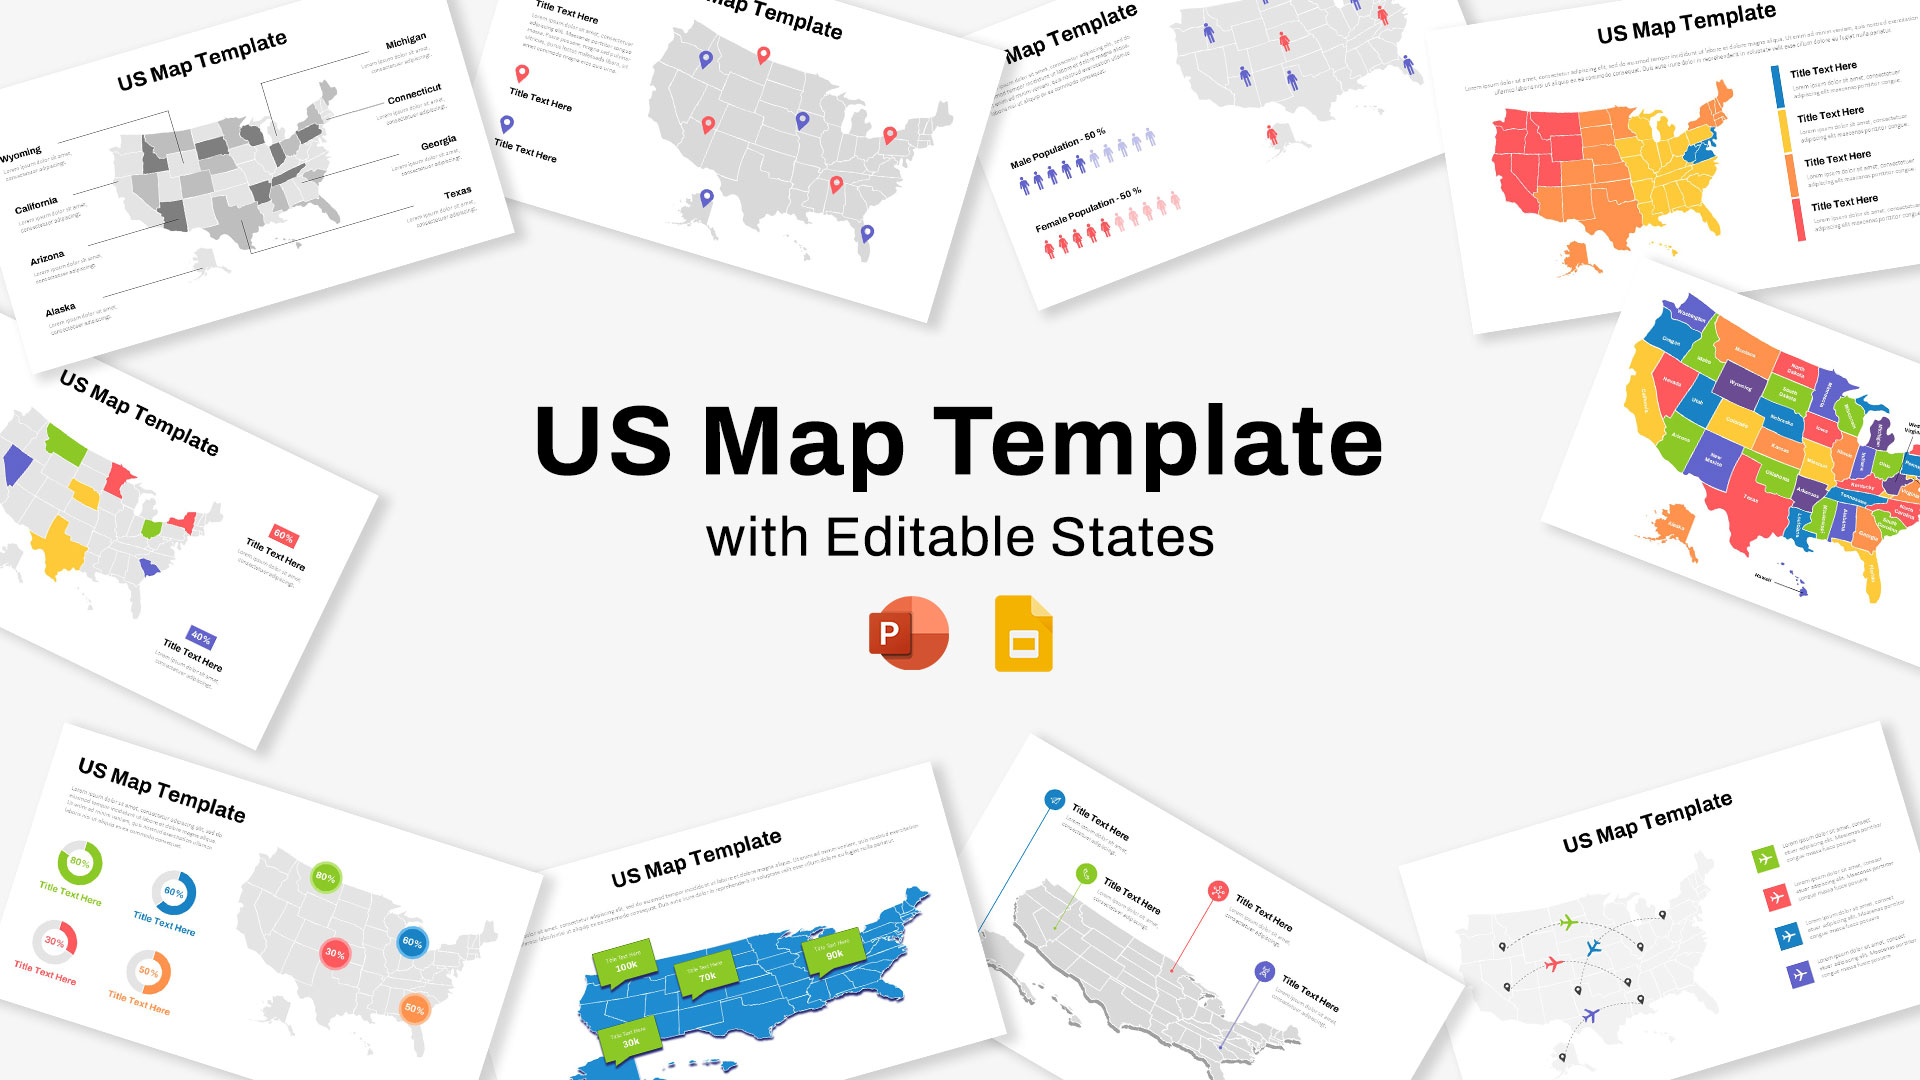
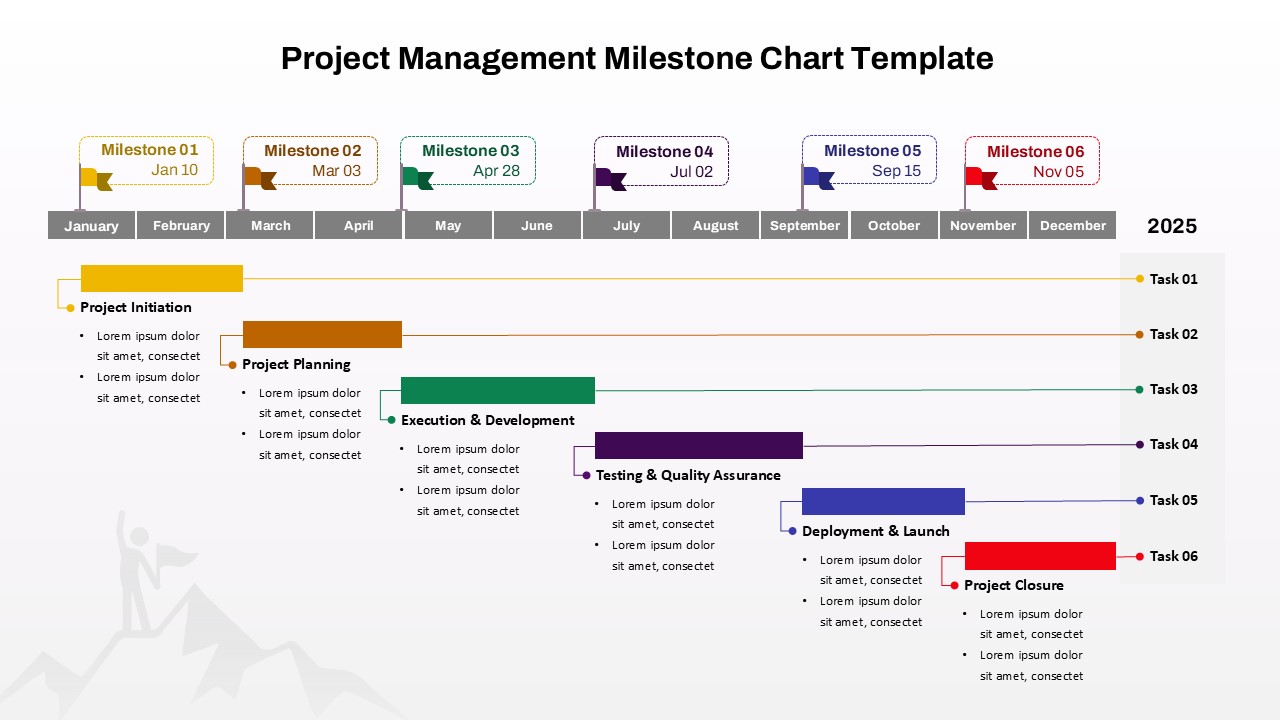
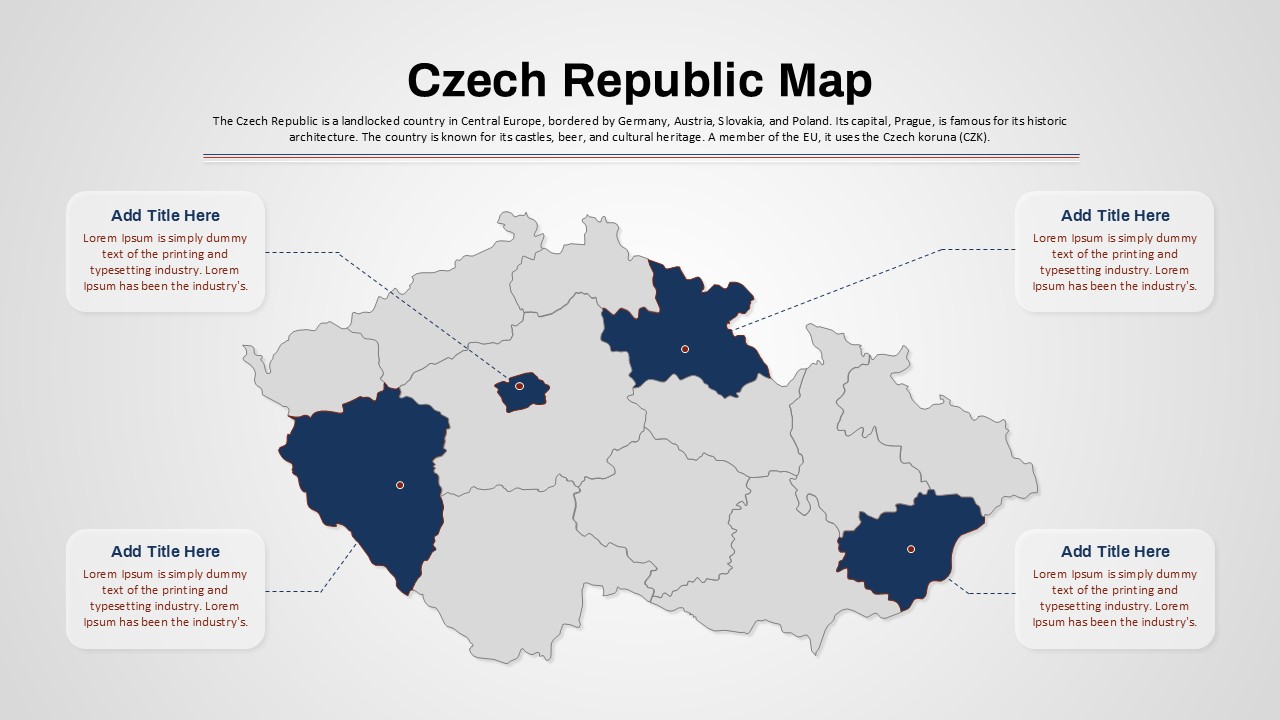
You May Also Like These Presentation Templates


- Free

- Free


- Free

- Free
- Free
- Free