Survey Results Infographics for Powerpoint Template


The Survey Results Infographic Template is a comprehensive and visually appealing tool designed to effectively communicate survey data. This template is ideal for presenting complex survey results in a clear, concise, and engaging manner. It is perfect for businesses, educators, researchers, and professionals who need to convey data insights with impact.
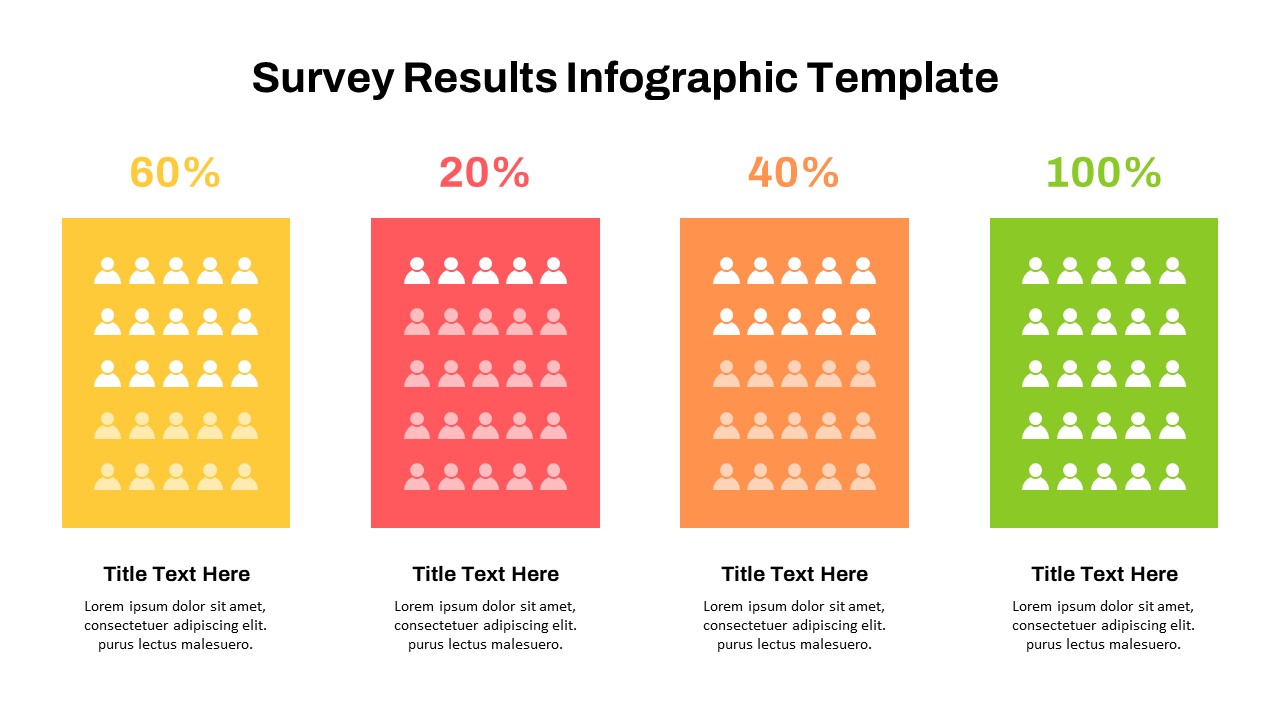
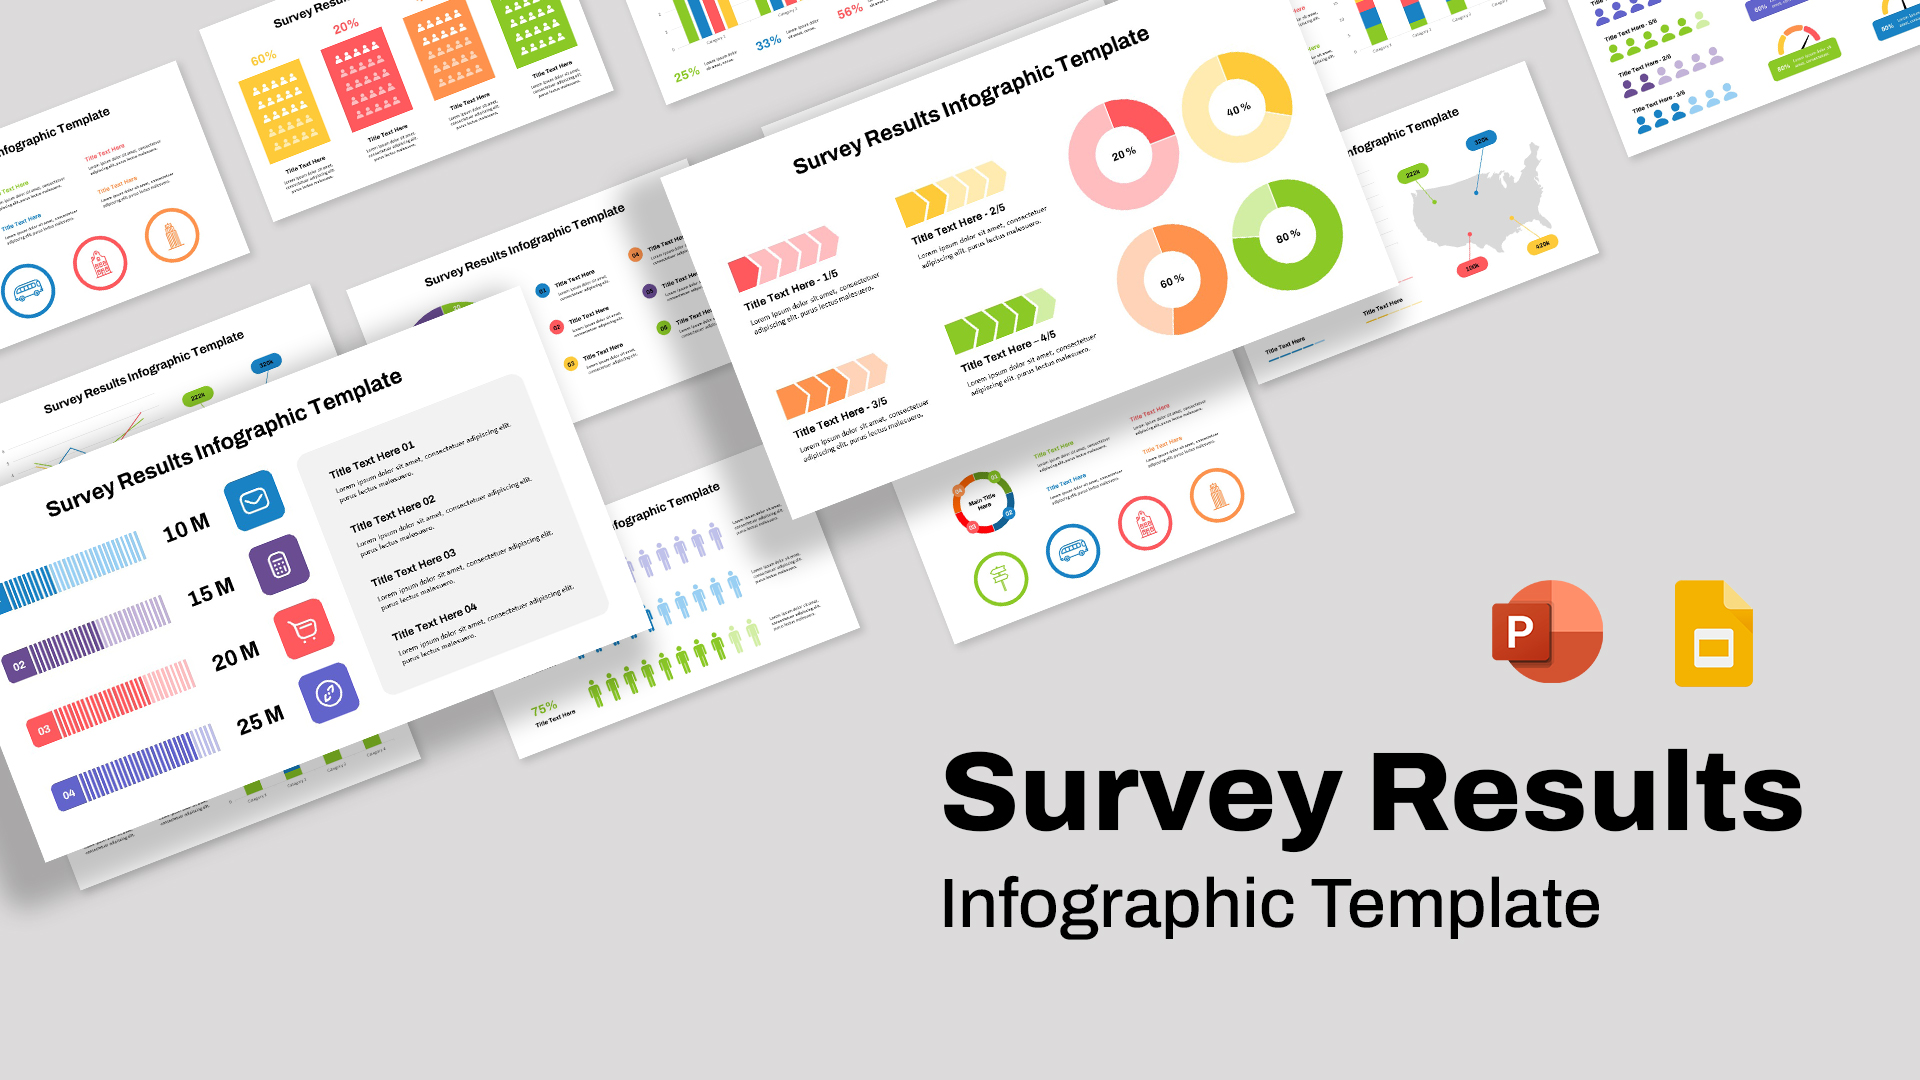
This template offers a variety of infographic styles, including bar charts, pie charts, maps, and icons, allowing for versatile data representation. Each slide is designed with a clean and modern aesthetic, ensuring that your audience remains focused on the data presented. The use of vibrant colors and intuitive layouts enhances the readability and attractiveness of the slides.
Whether you're presenting market research findings, academic survey results, or internal company surveys, this template provides the tools needed to make your data stand out. Its user-friendly design ensures that even those with minimal graphic design experience can create professional and polished presentations.
See more


