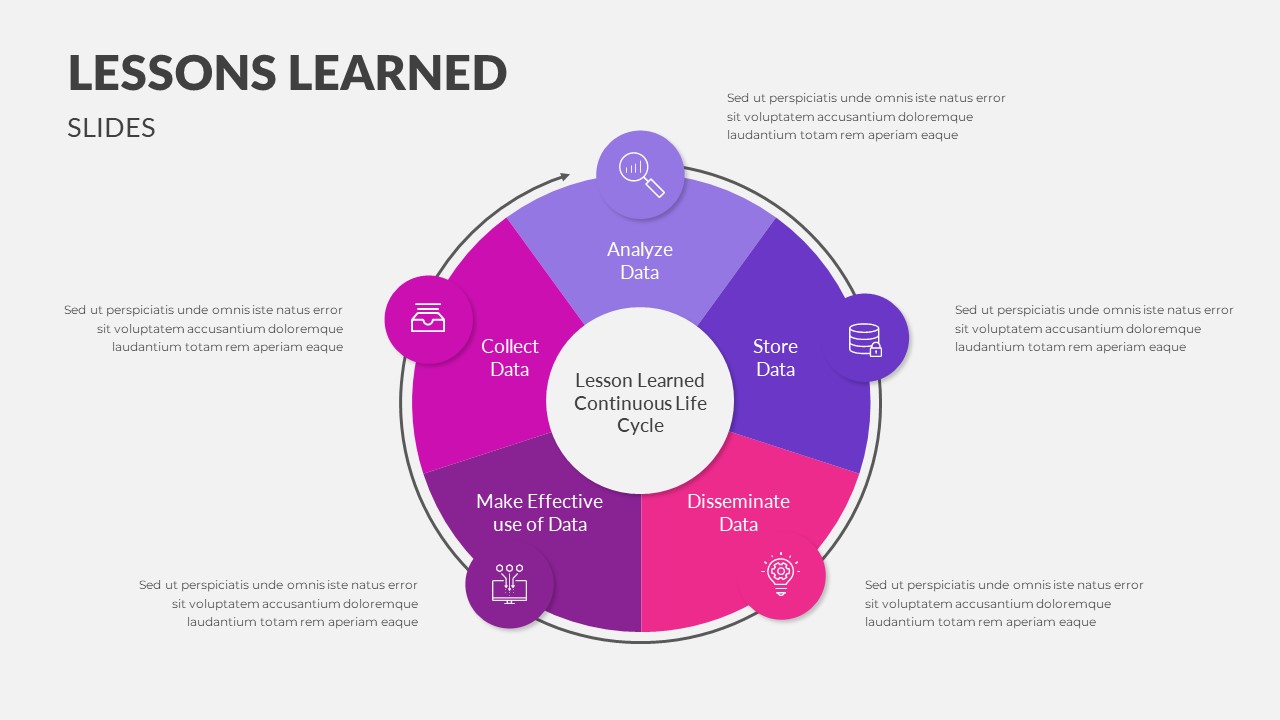
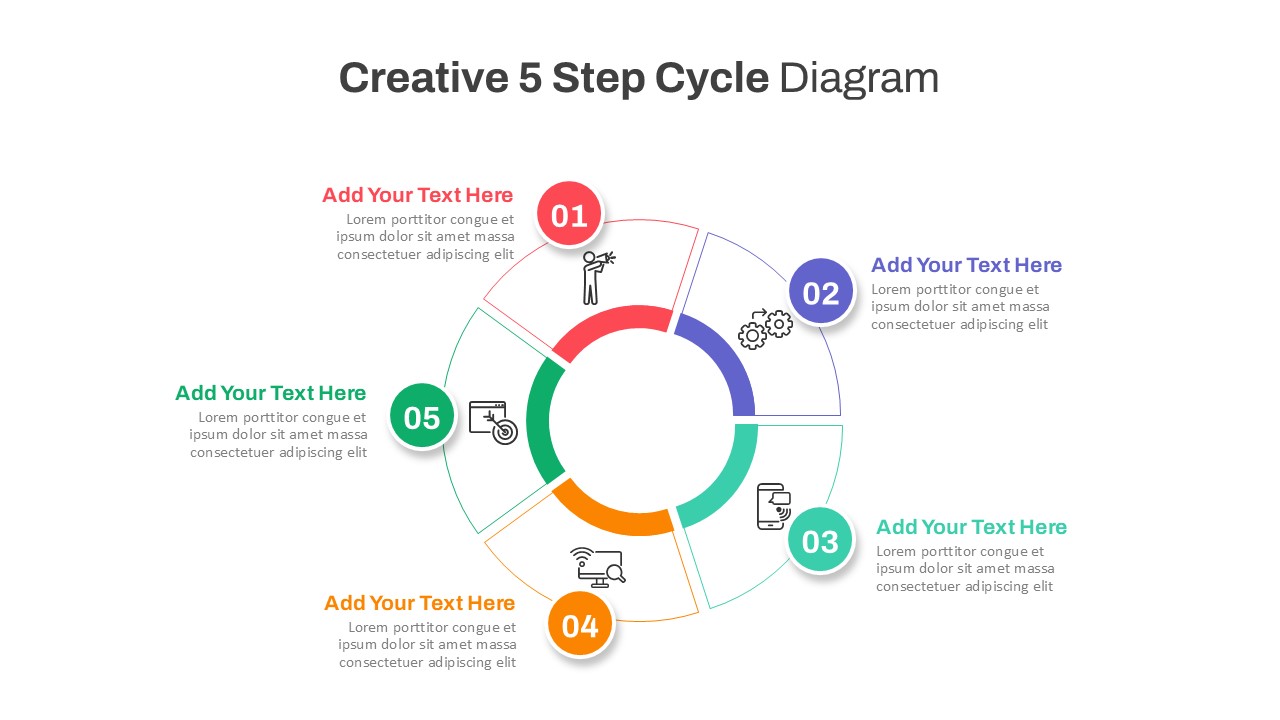
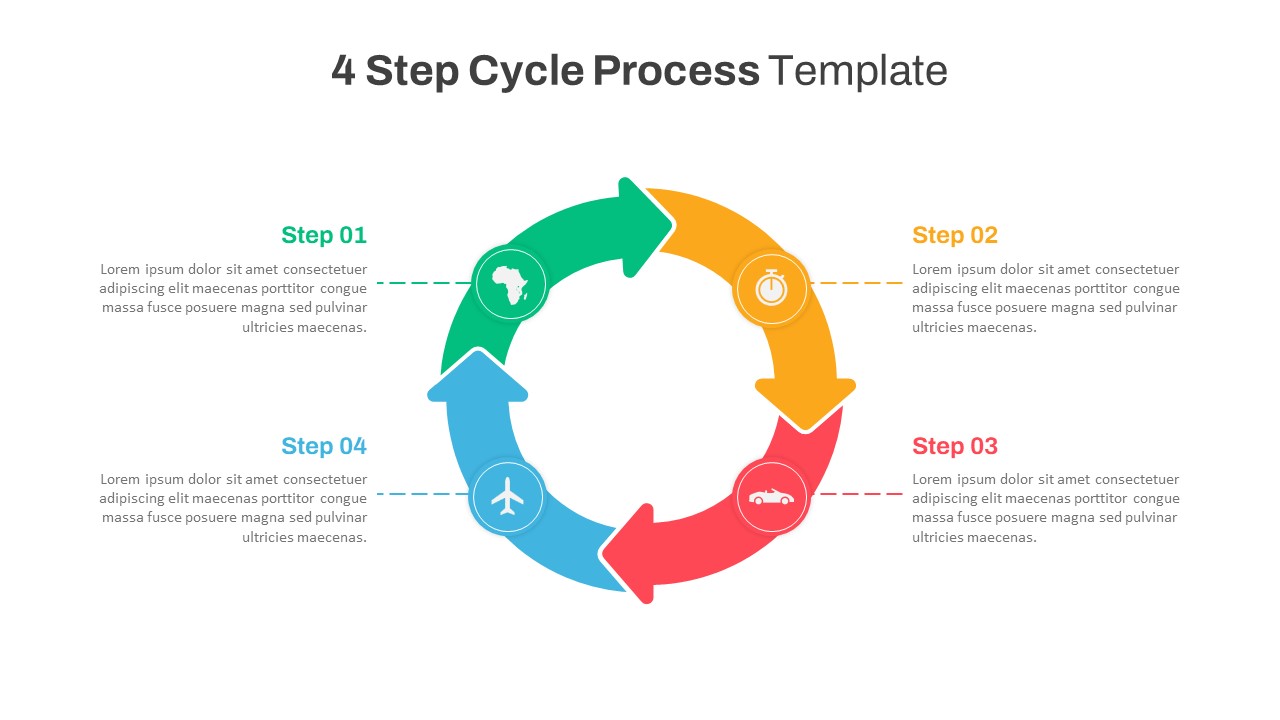
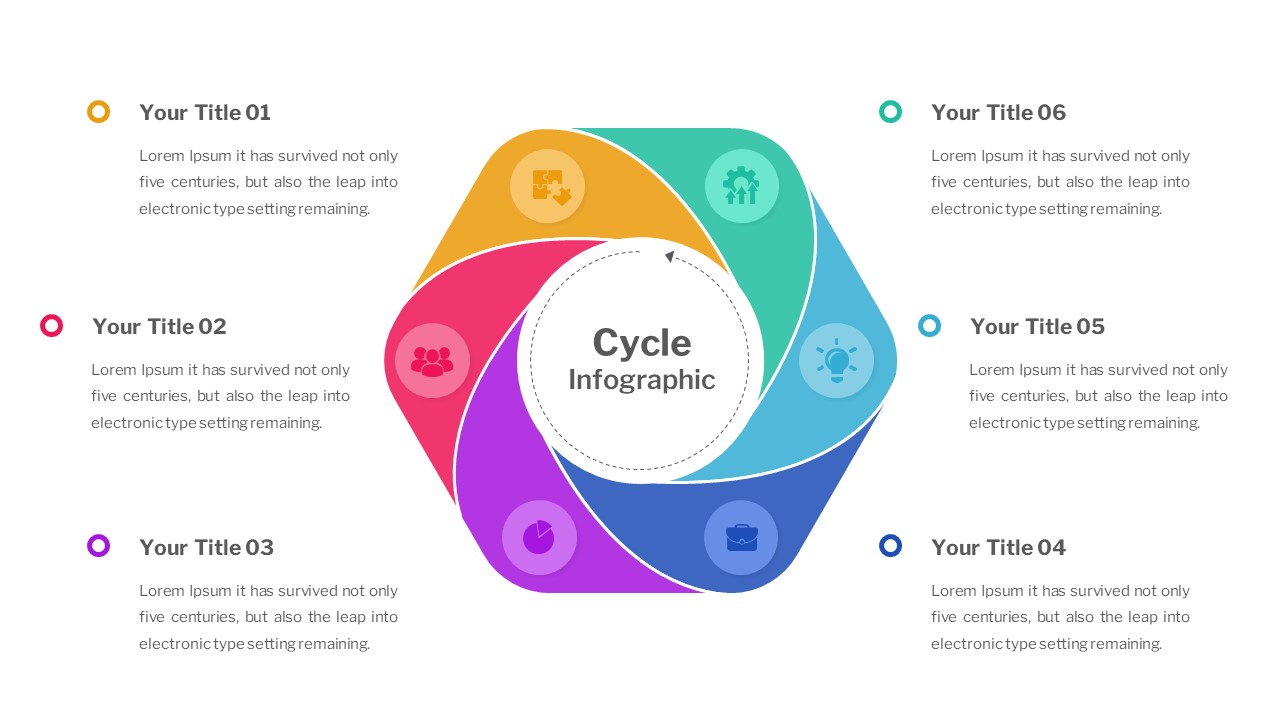
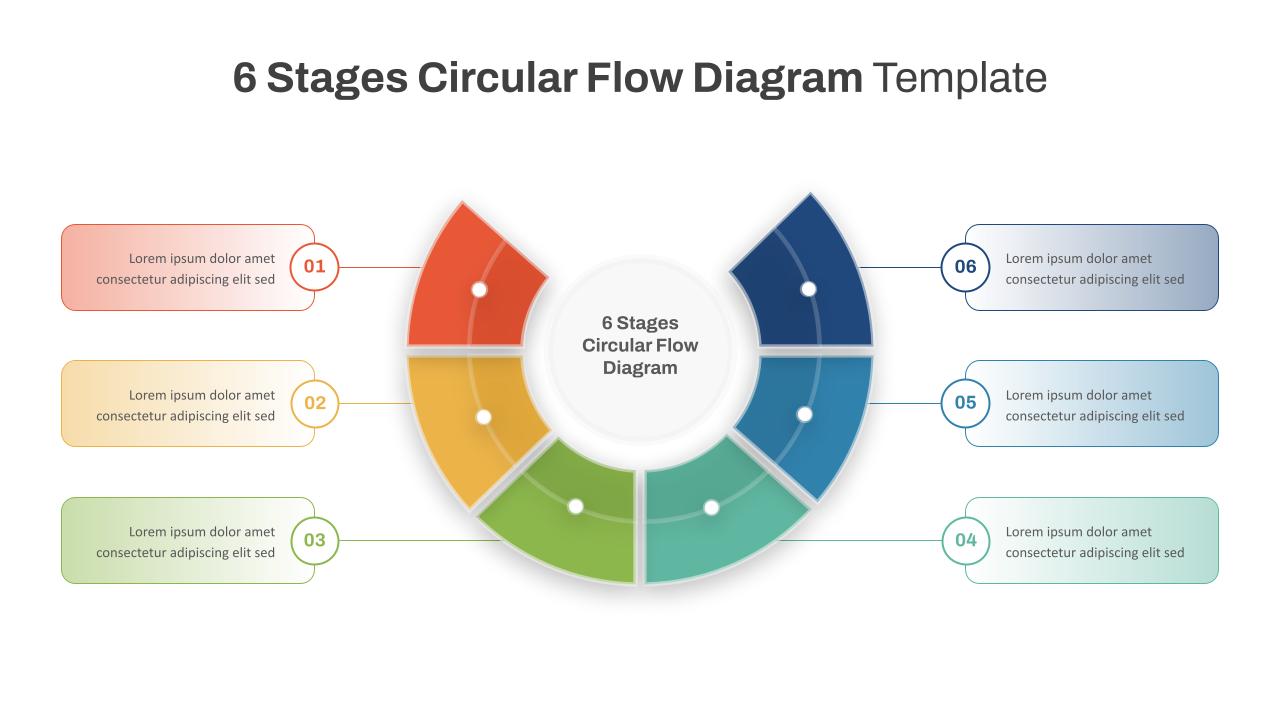
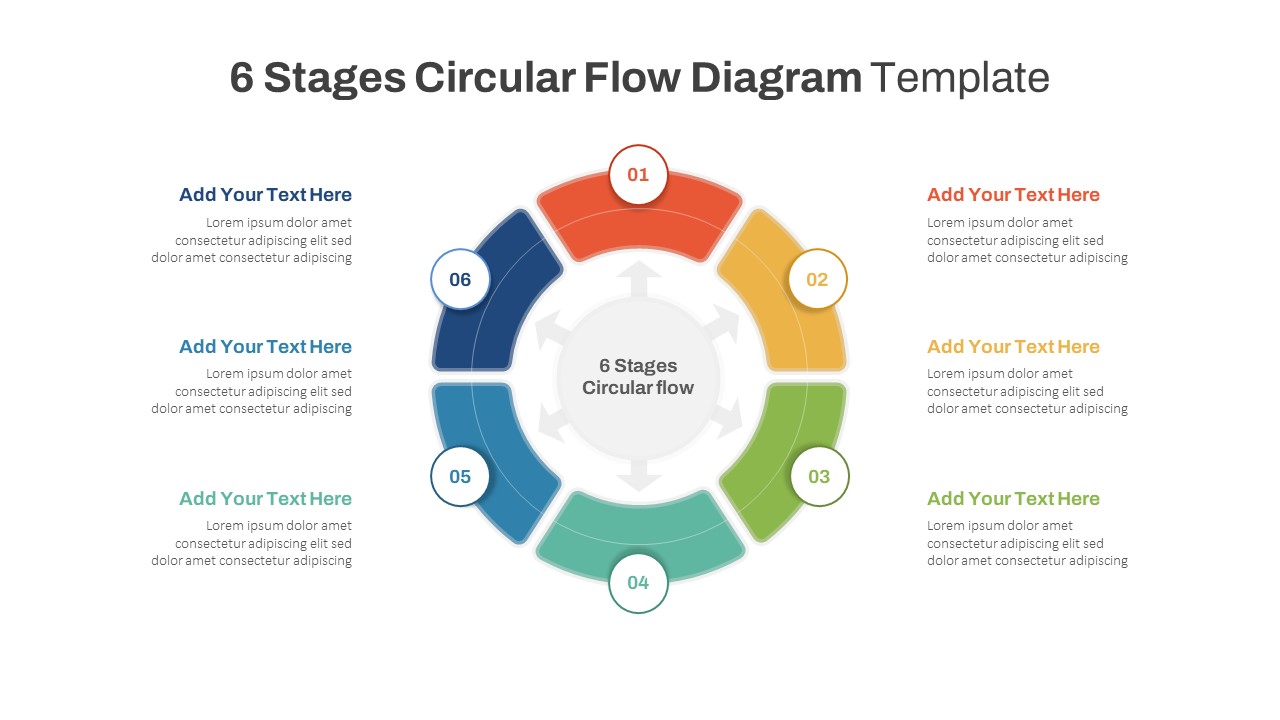
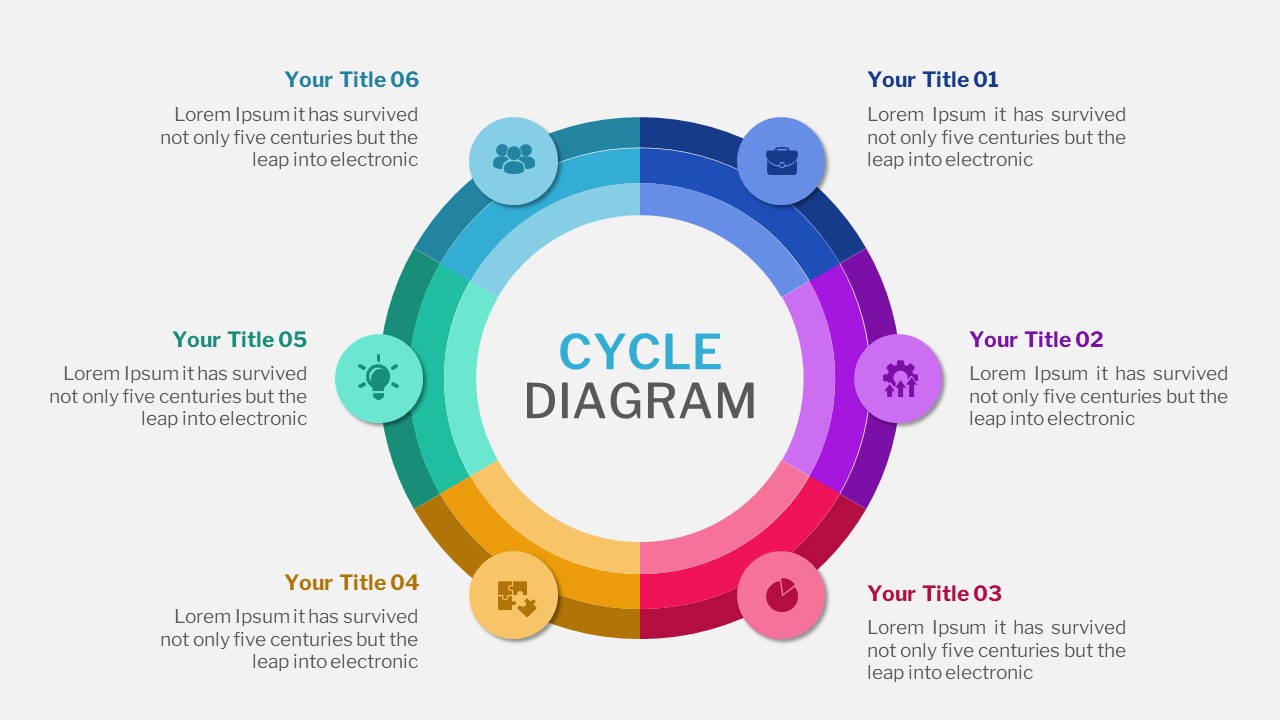
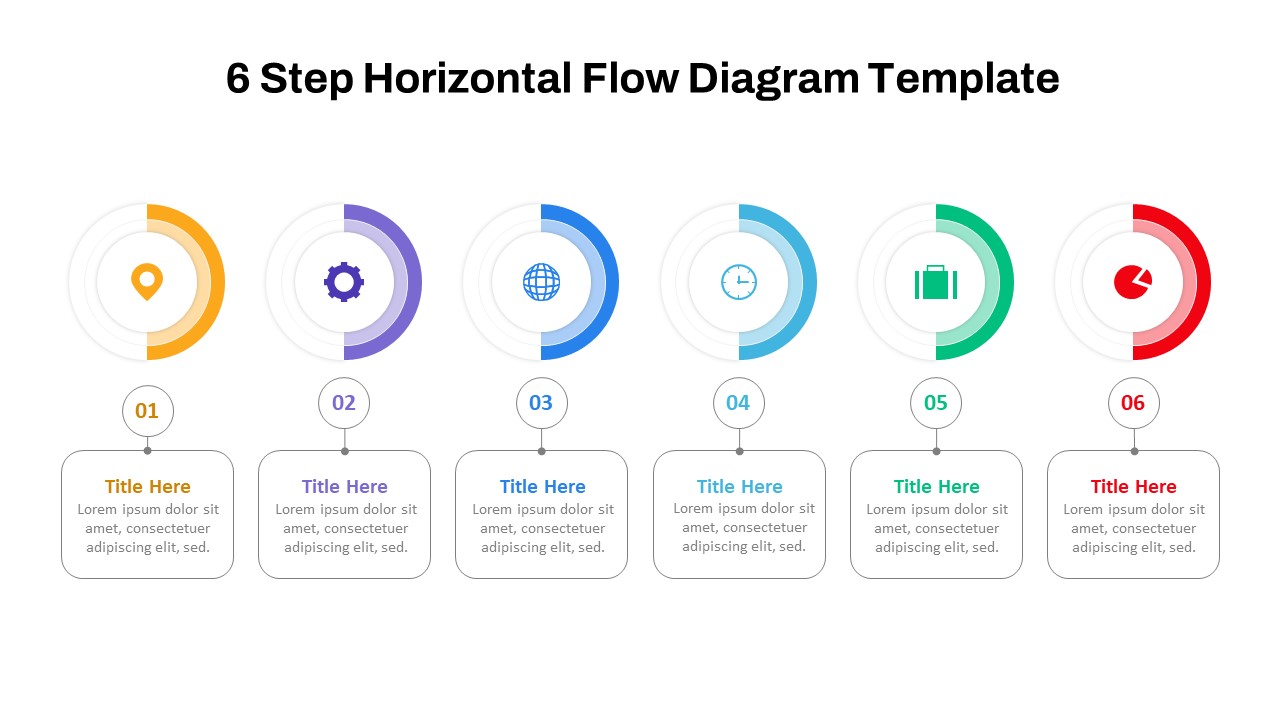
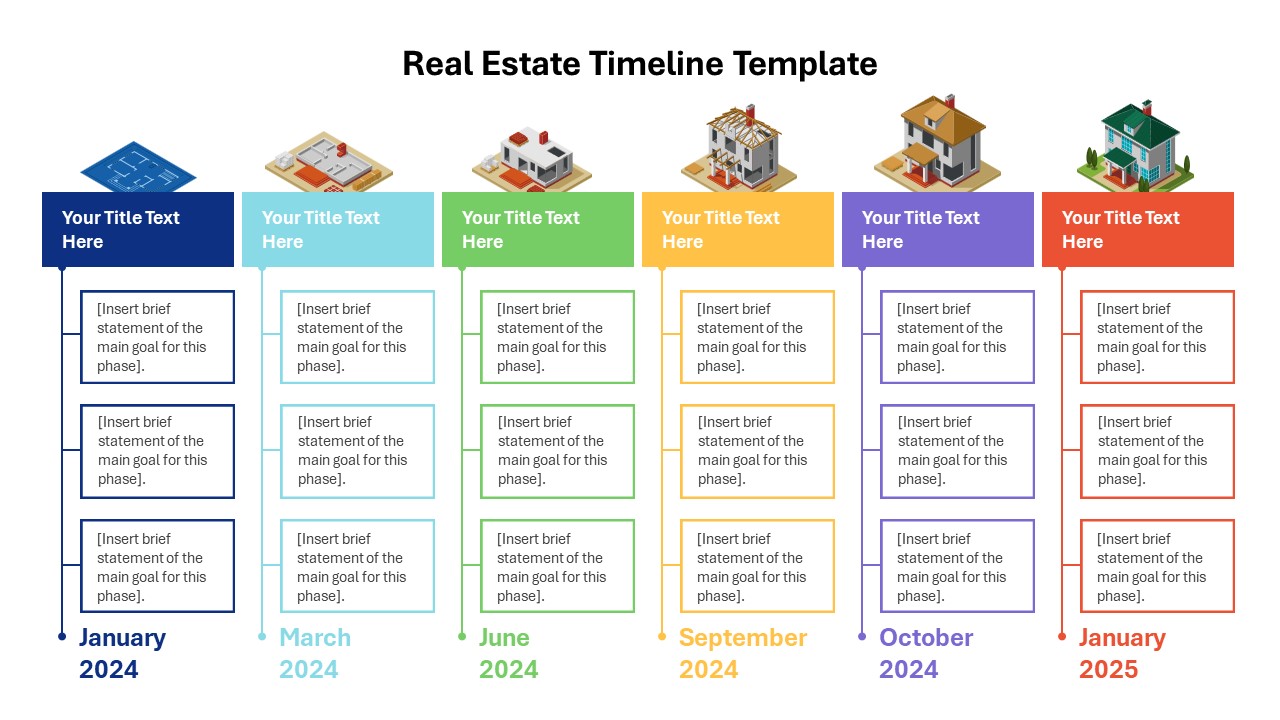
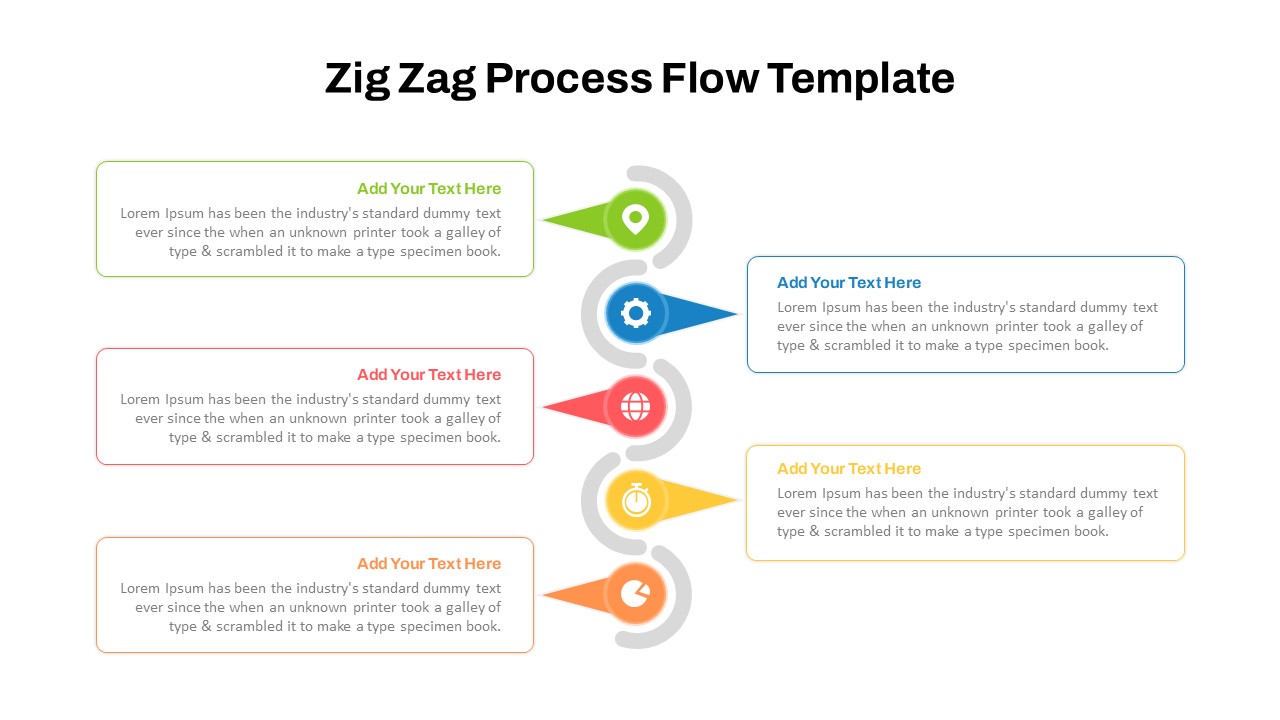
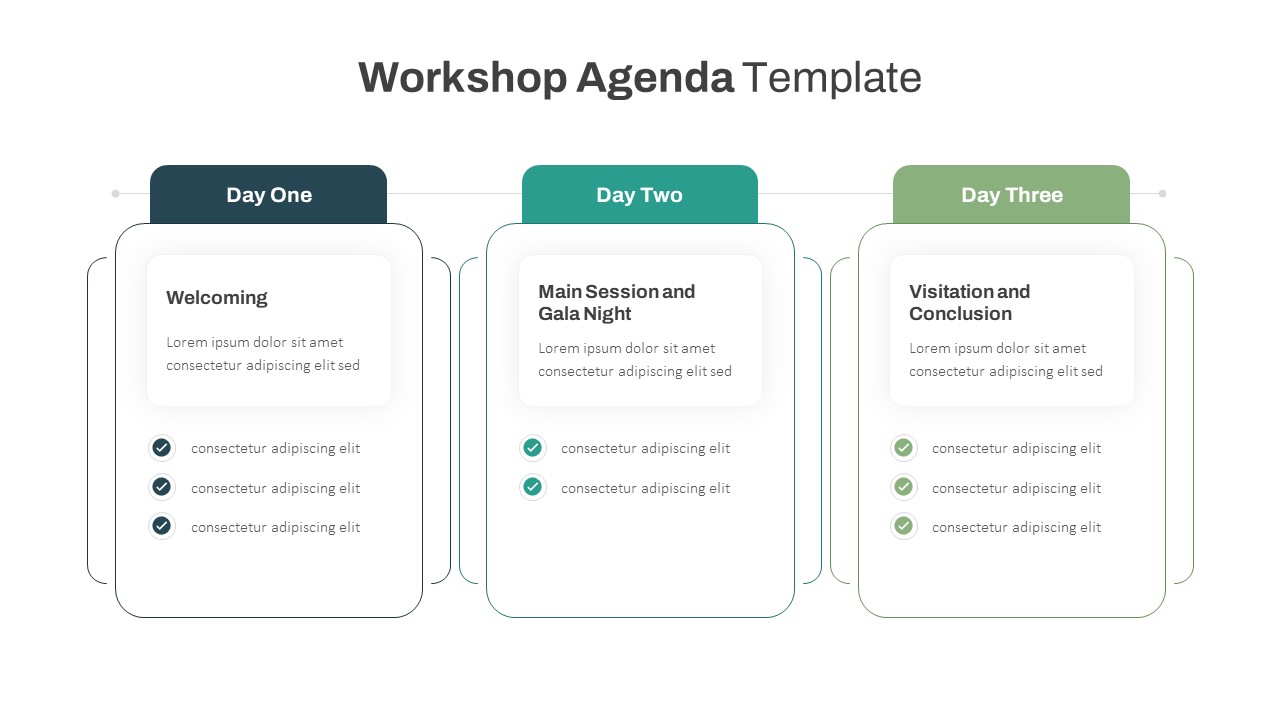
Three Phase Cycle Diagram For PowerPoint Presentation
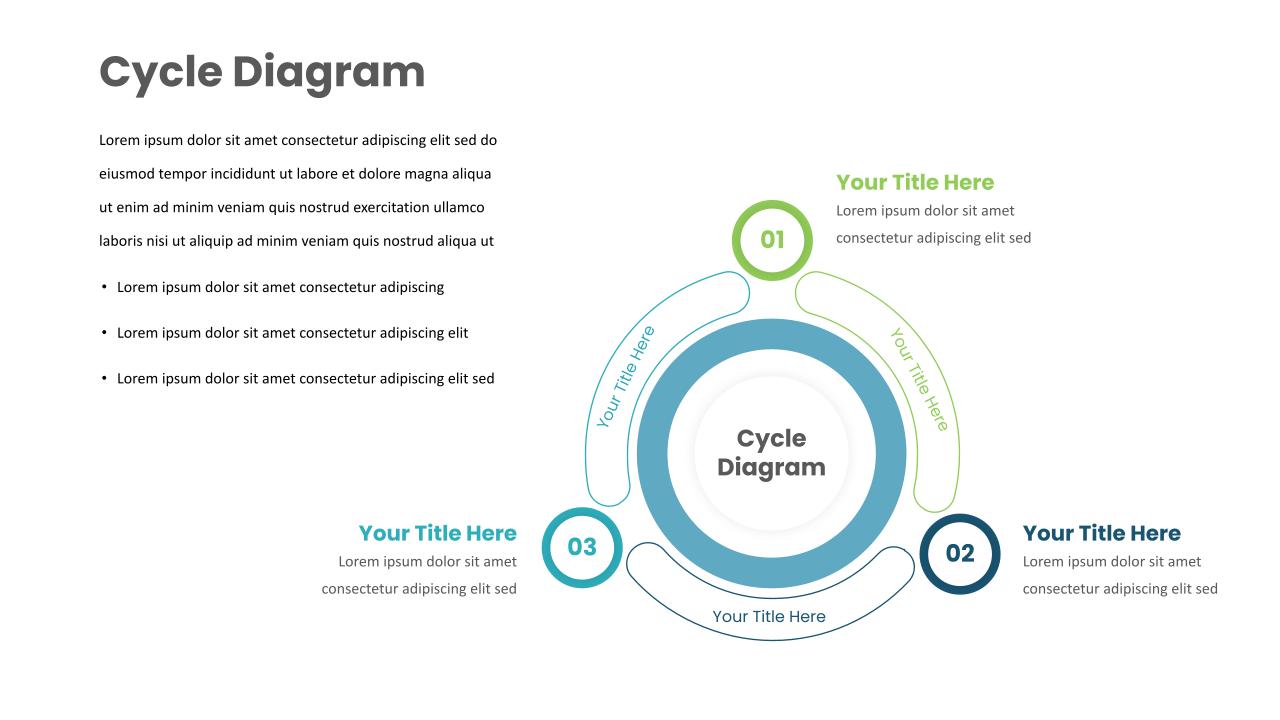


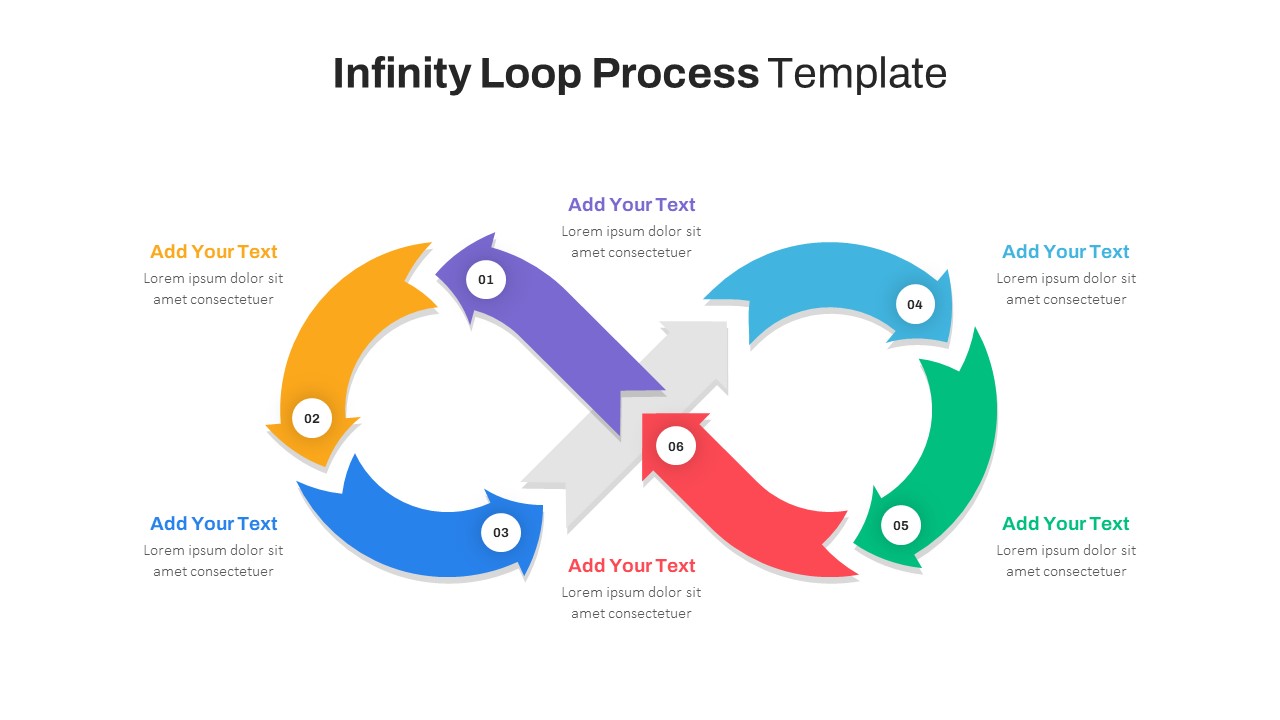
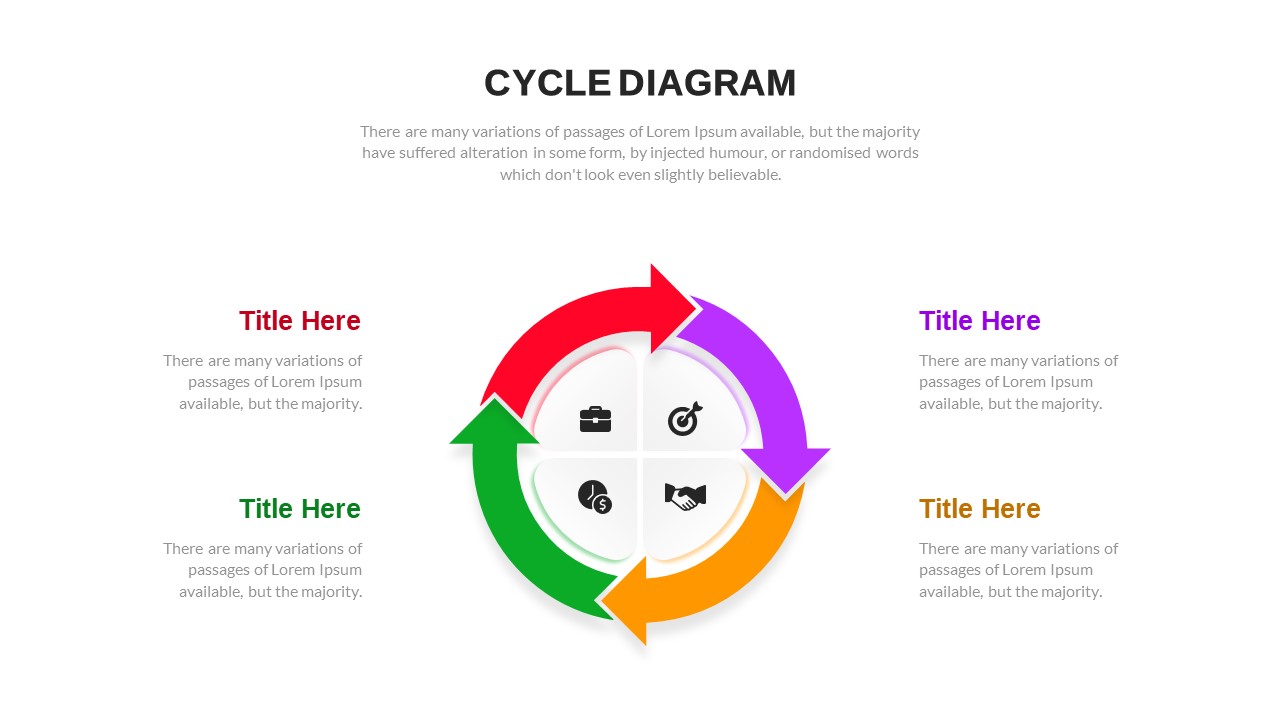
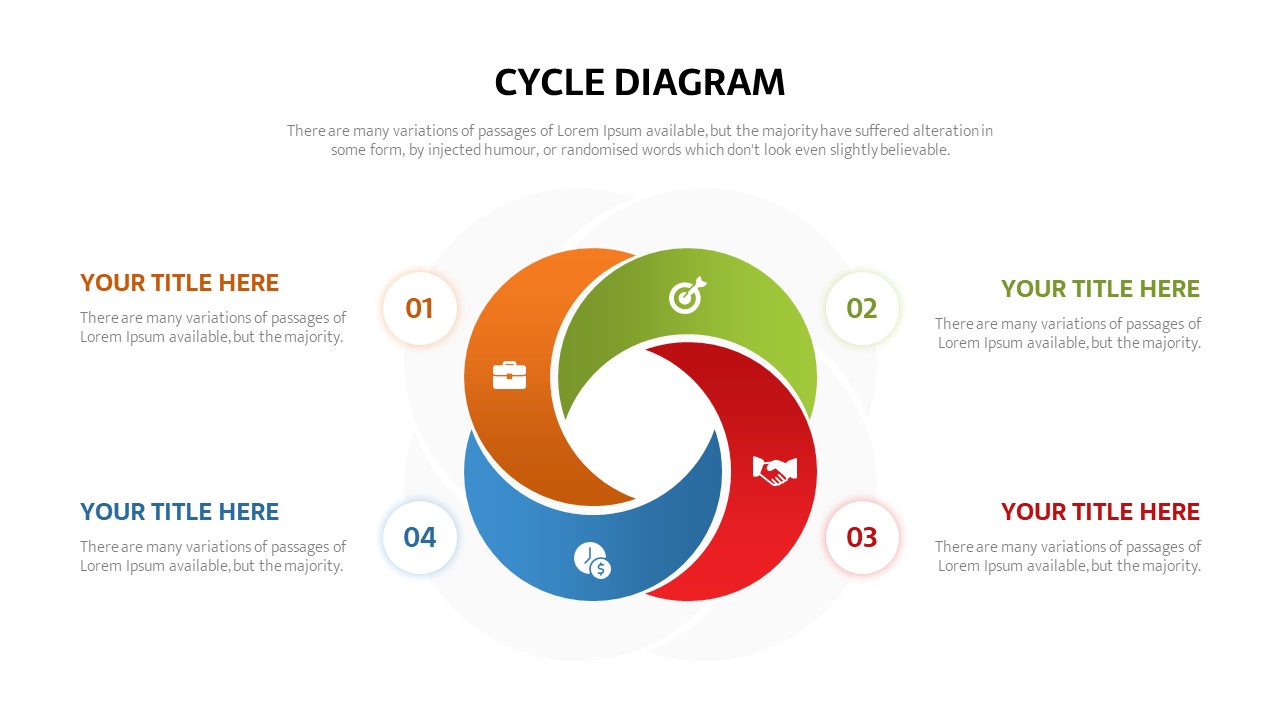
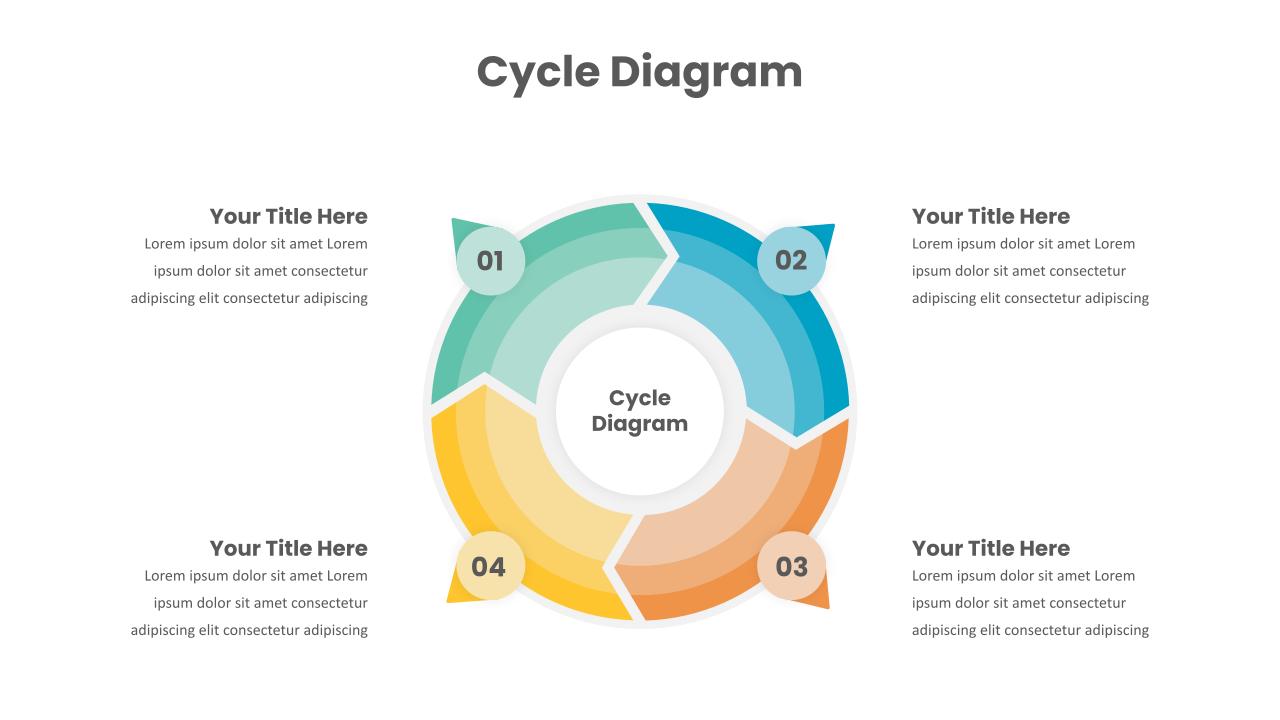
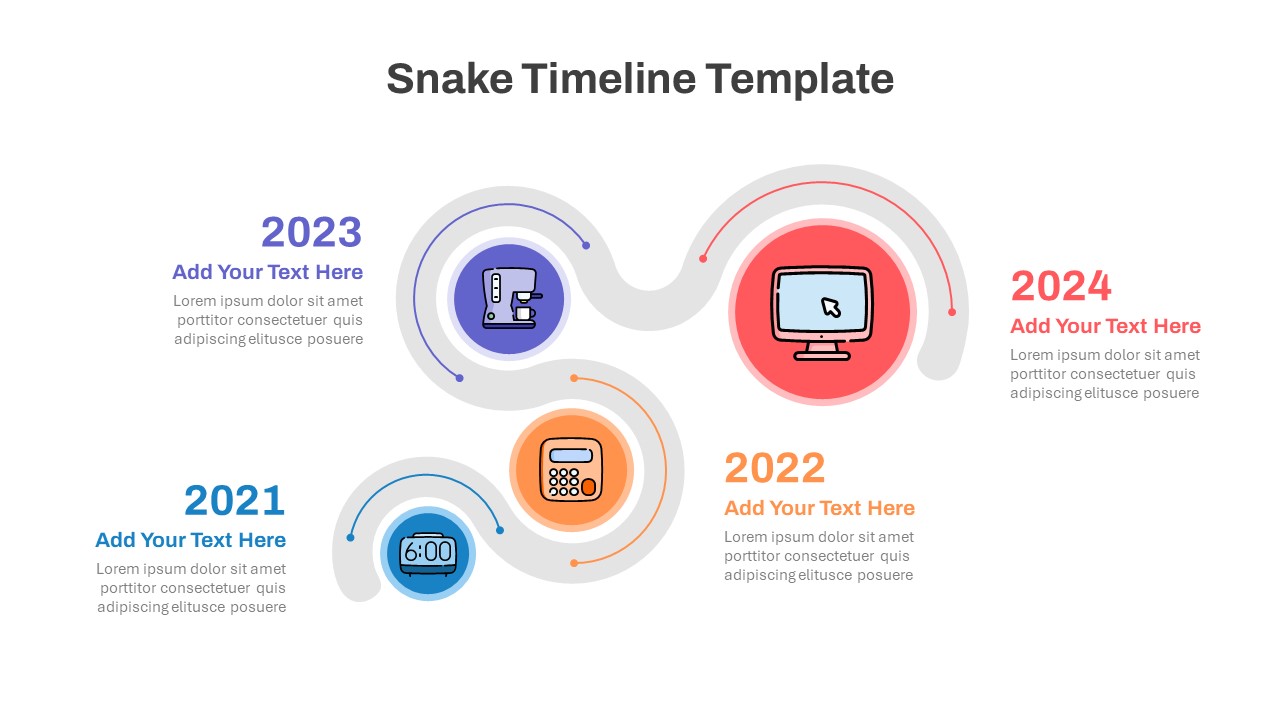
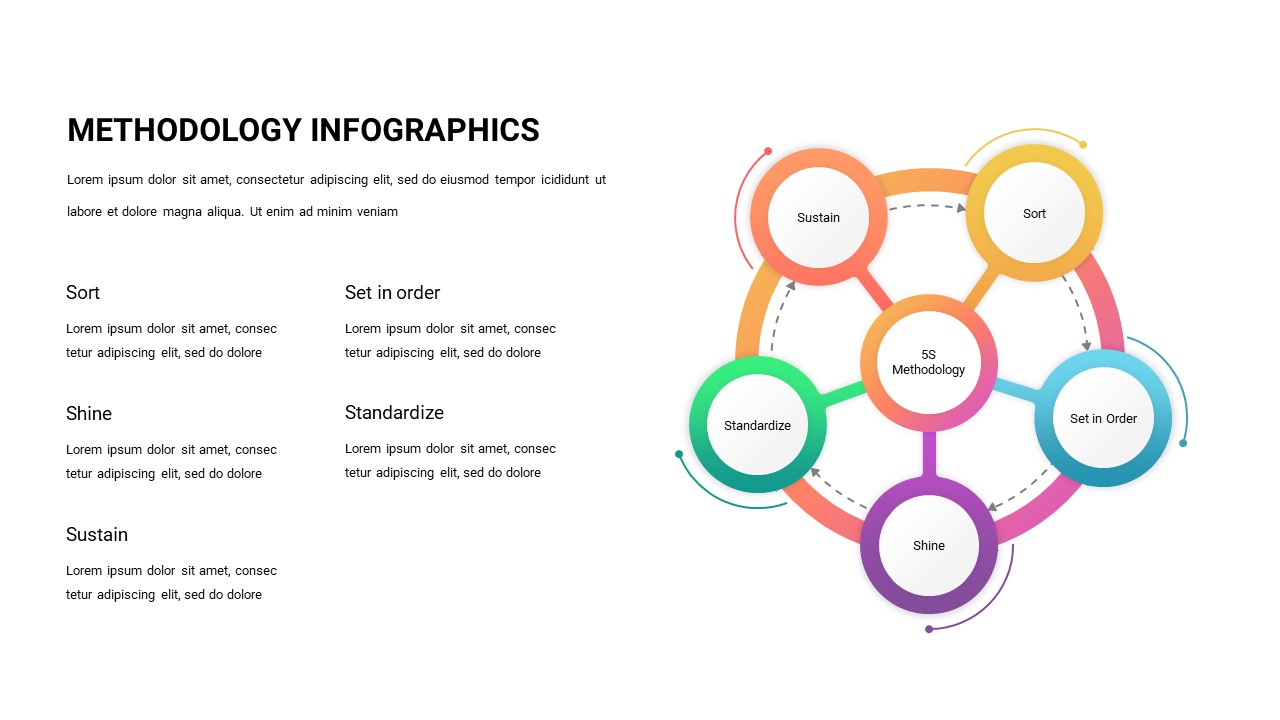
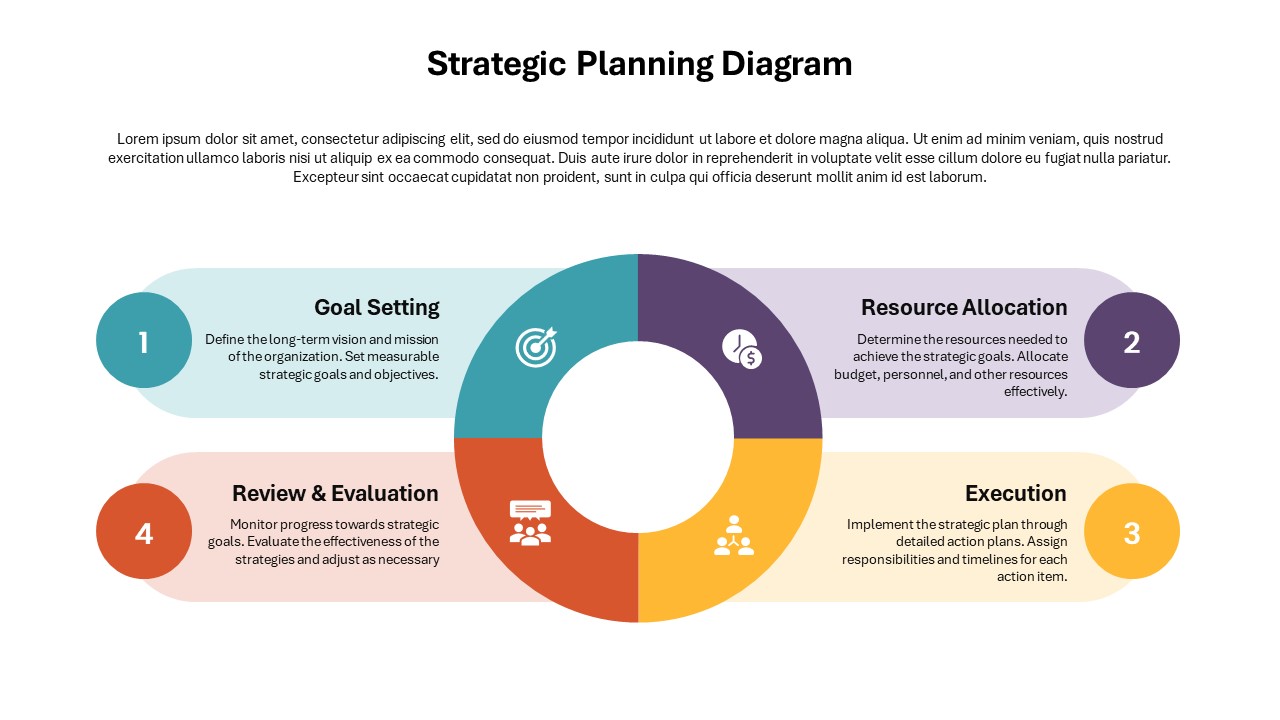
The Three-Phase Cycle Diagram For PowerPoint is an elegantly designed tool that allows you to illustrate processes that follow a cyclic pattern, making it ideal for presenting ideas in a structured and continuous format. The template features three interconnected circular segments that radiate outward, each clearly labeled and color-coded for easy identification. This intuitive design ensures your audience can grasp the flow and interdependencies between each phase with clarity and ease. At the center, a bold “Cycle Diagram” title further reinforces the concept of an ongoing process.
The minimalist style of this cycle infographic PowerPoint template allows for flexible use, whether you’re explaining project management cycles, operational workflows, or any recurring process that requires sequential detailing. Text placeholders adjacent to each phase make it convenient to provide detailed explanations for each step, while bullet points on the left-hand side offer space to summarize key points or actions. The colors used—light greens, blues, and grays—convey a sense of calm professionalism, ensuring that the design remains visually engaging without overwhelming the viewer.
This cycle diagram is available in both PowerPoint and Google Slides formats, providing you with the flexibility to adapt it to your preferred presentation platform. As a versatile tool, it works perfectly for corporate presentations, educational content, strategic planning meetings, or brainstorming sessions. Whether you need to demonstrate an iterative process, explain a business model, or depict a continuous improvement cycle, this template is your ideal solution for visually compelling and informative presentations.
See more

Aspect Ratio
16:9Item ID
SKT00685
FAQs
You May Also Like These Presentation Templates

- Free

- Free
- Free
- Free