Whale Curve Customer Profitability Analysis PPT Template

Gain a deeper understanding of your customer base and its impact on profitability with our Whale Curve Customer Profitability Analysis PPT Template. This template visually represents the distribution of customer profitability, highlighting the critical “whales” (highly profitable customers) and areas for improvement. Designed for executives, financial analysts, and strategic decision-makers, this template illustrates how different customer segments contribute to or detract from overall profitability.
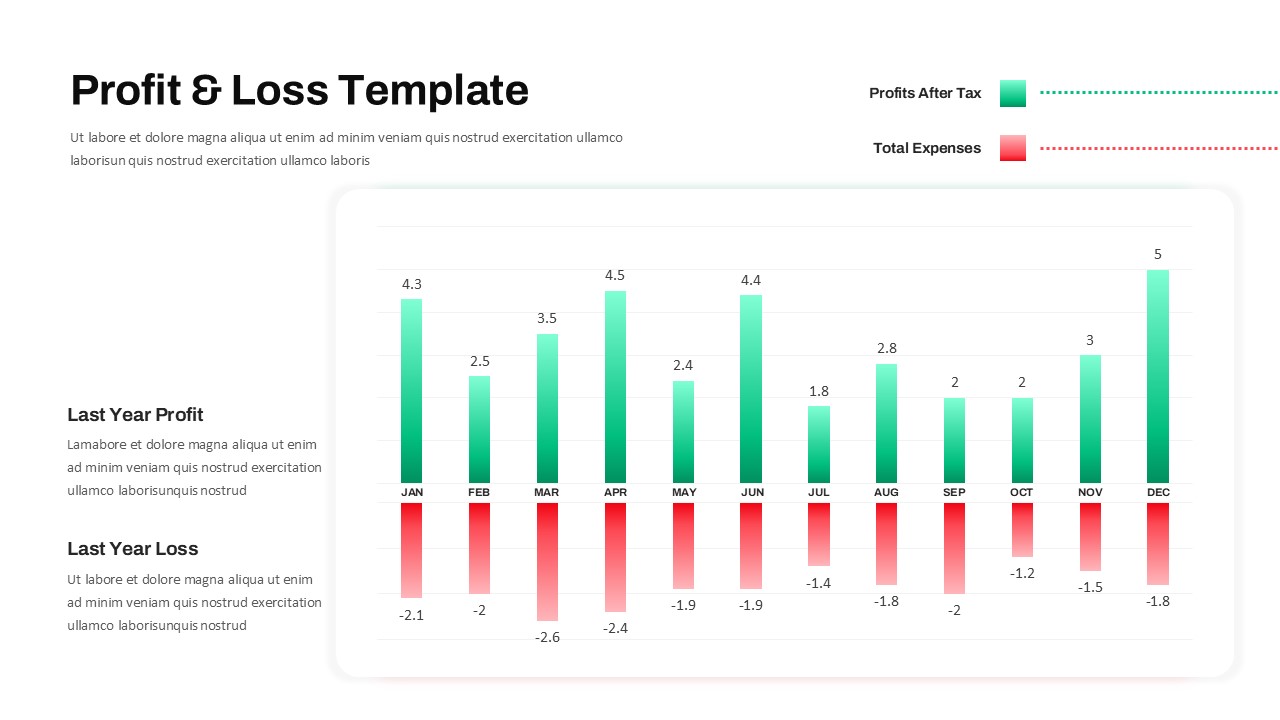
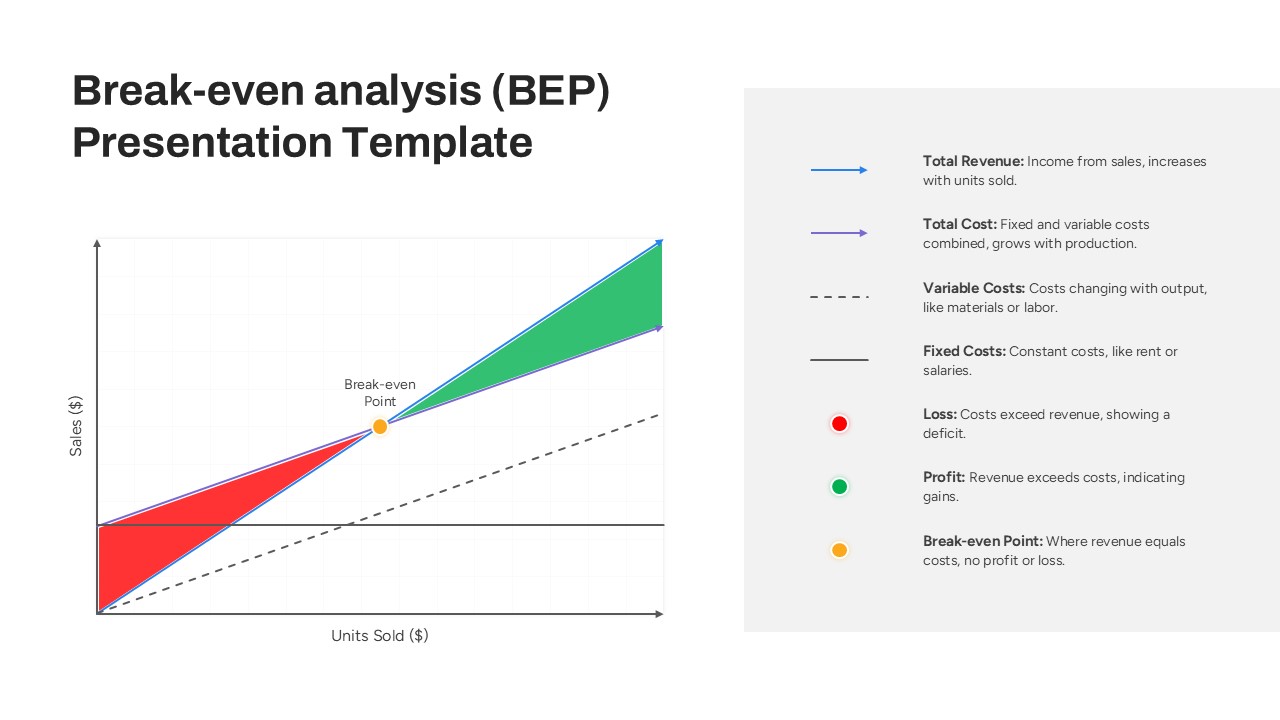
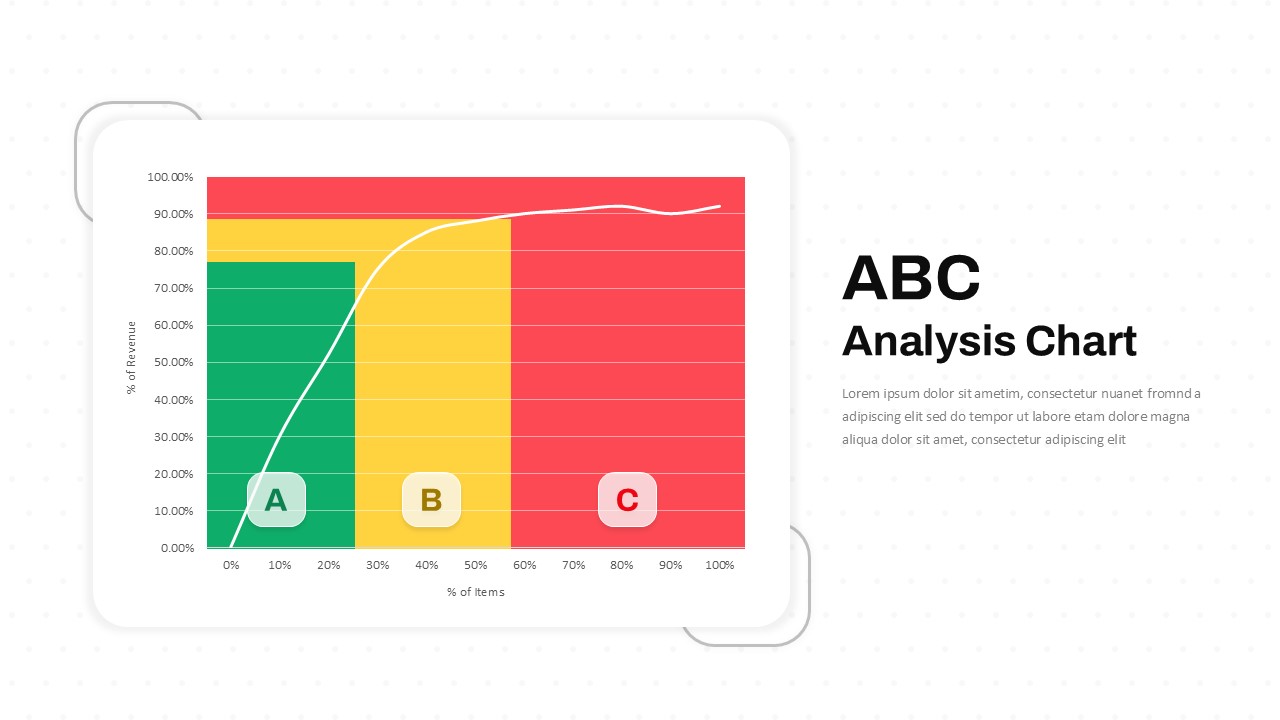
At the heart of the presentation is the whale curve—a cumulative profit graph shaped like a whale, showing how 20% of customers generate the majority of profits, 60% break even, and the final 20% erode profits. This visualization allows users to distinguish between high-value customers and loss-generating segments, enabling more targeted retention, upselling, and operational improvement strategies.
The chart is cleanly divided into three zones: green (profitable customers), blue (unrealized profit potential), and red (profit-draining customers), offering a straightforward narrative that executives and stakeholders can quickly grasp. This makes the template ideal for business reviews, financial performance reports, and strategic planning meetings where understanding customer impact is key.
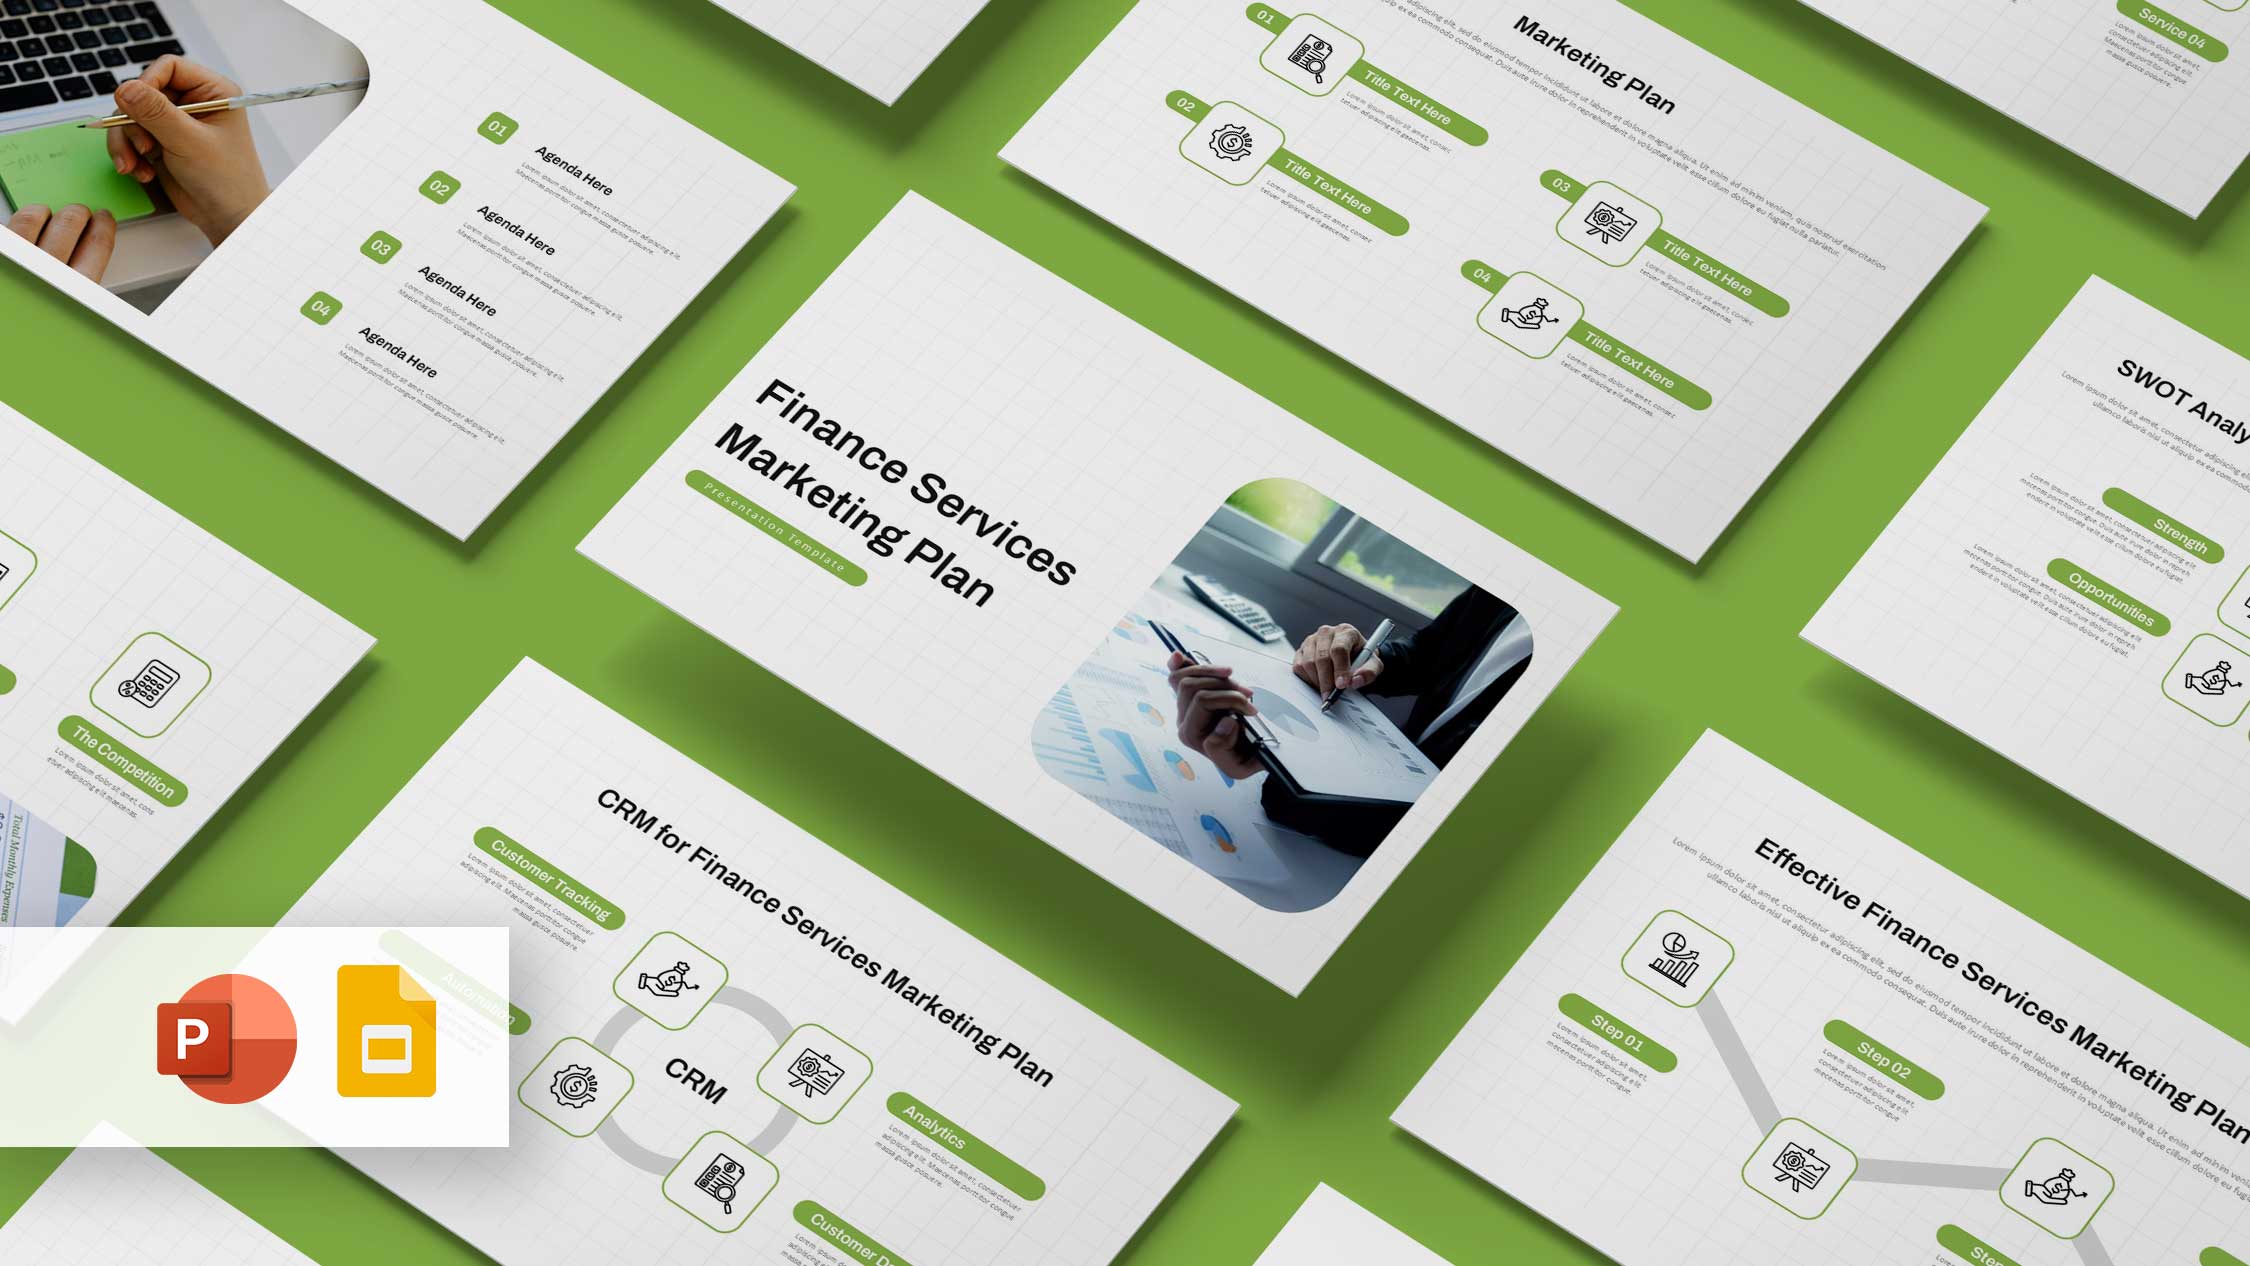
Compatible with both PowerPoint and Google Slides, the template is fully editable. Users can customize colors, annotations, and data points to align with specific business metrics or customer segmentation models. Whether you’re working in B2B, SaaS, retail, or service-based industries, this presentation tool helps visualize opportunities for revenue optimization and customer value enhancement.
See more

Aspect Ratio
16:9Item ID
SKT03425
Features of this template
Other User Cases of the Template:
Customer profitability analysis, financial strategy presentations, executive business reviews, churn analysis, account segmentation reports, sales performance reviews, customer value mapping, investor presentations, CFO and FP&A dashboards, SaaS revenue optimization
FAQs
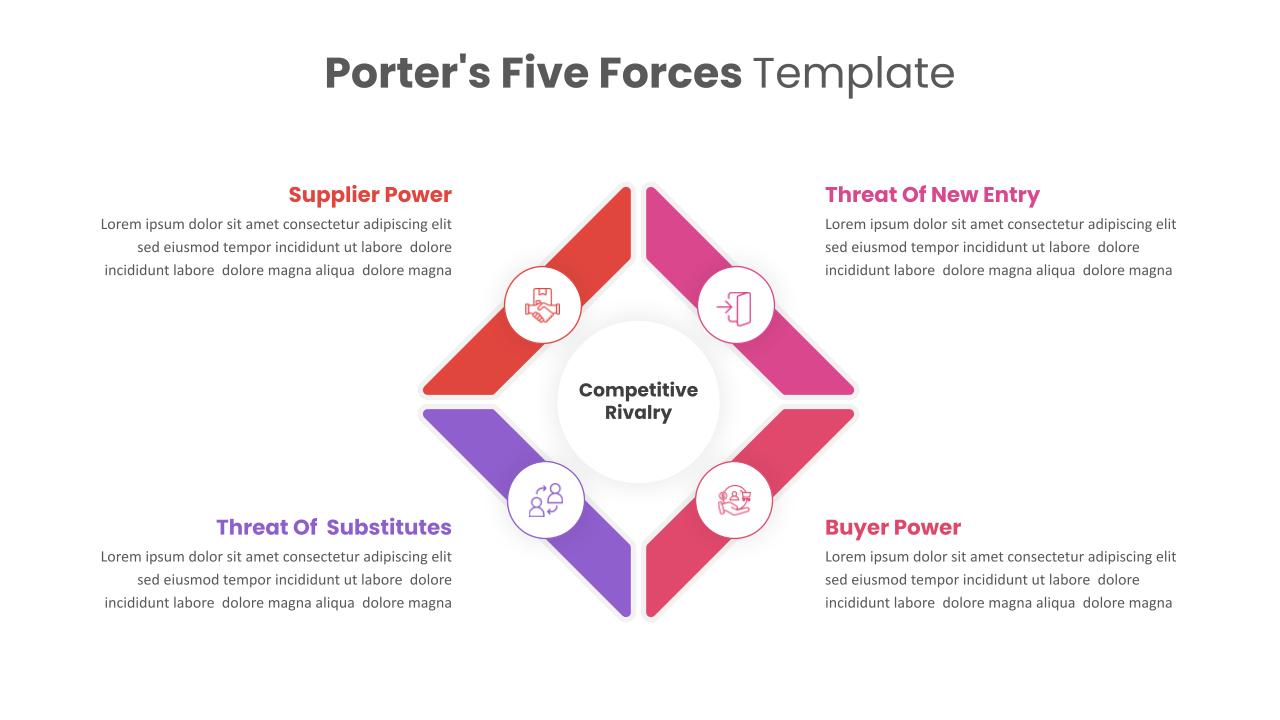
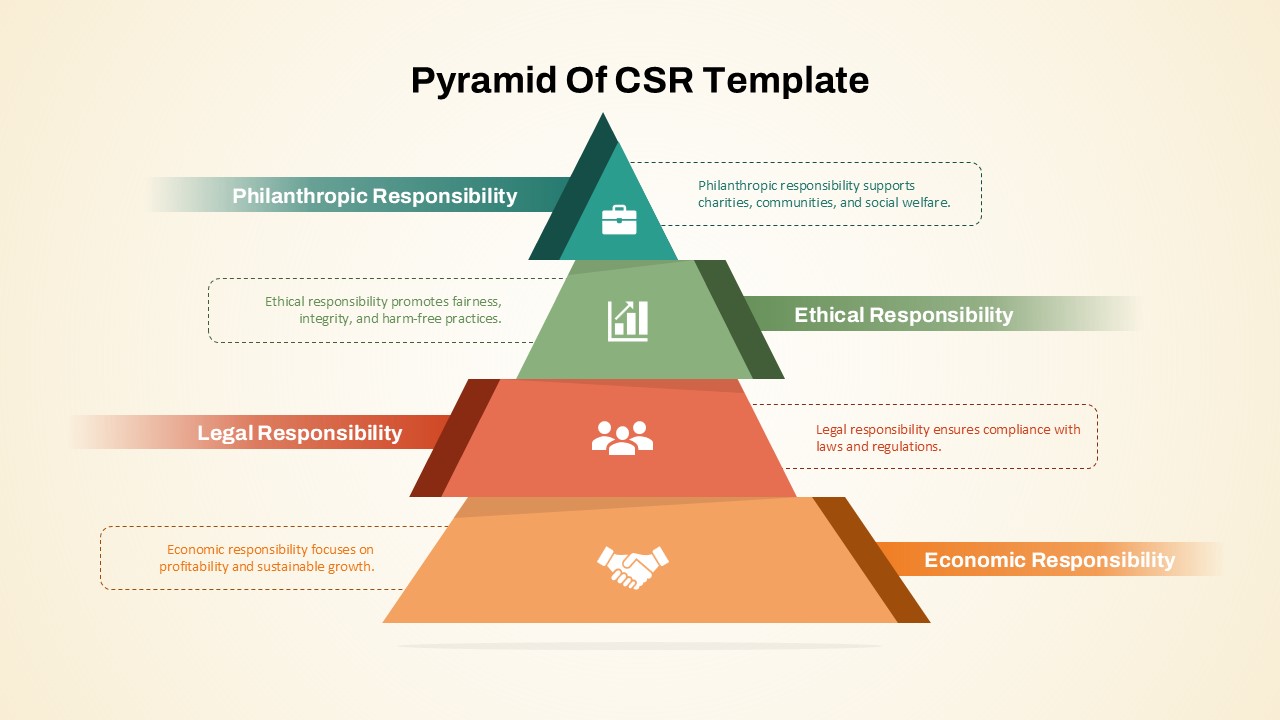
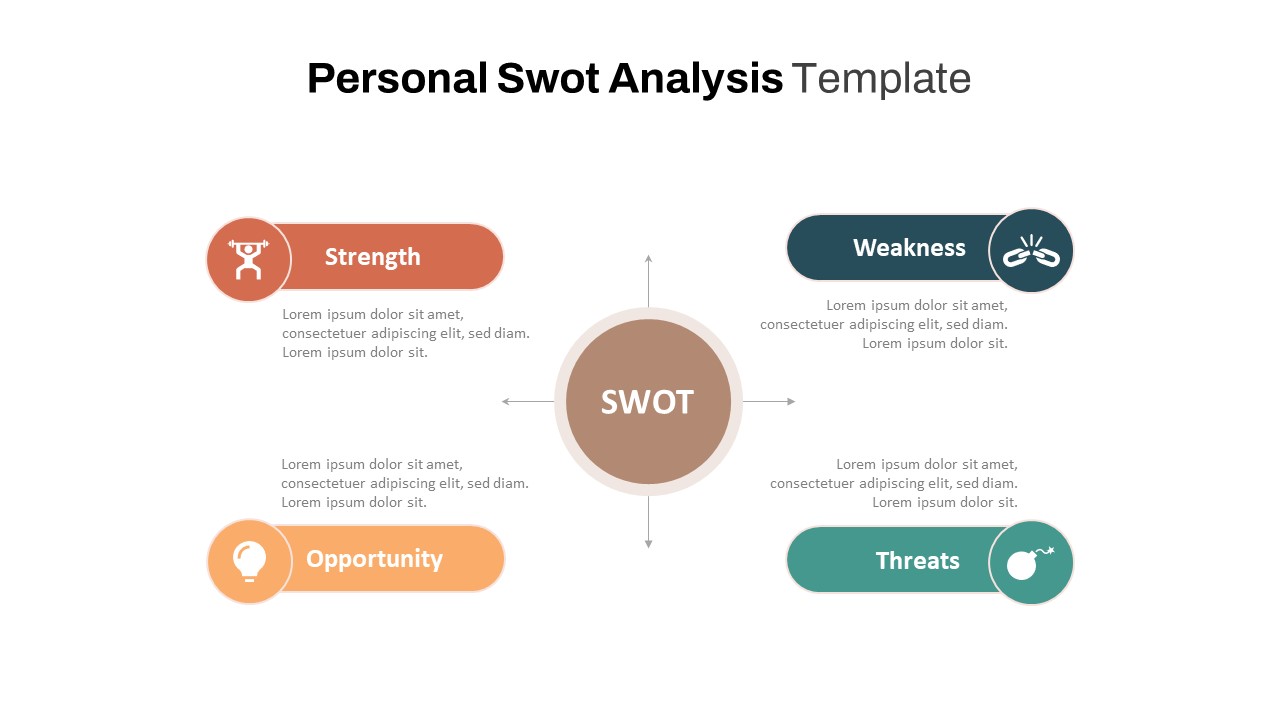
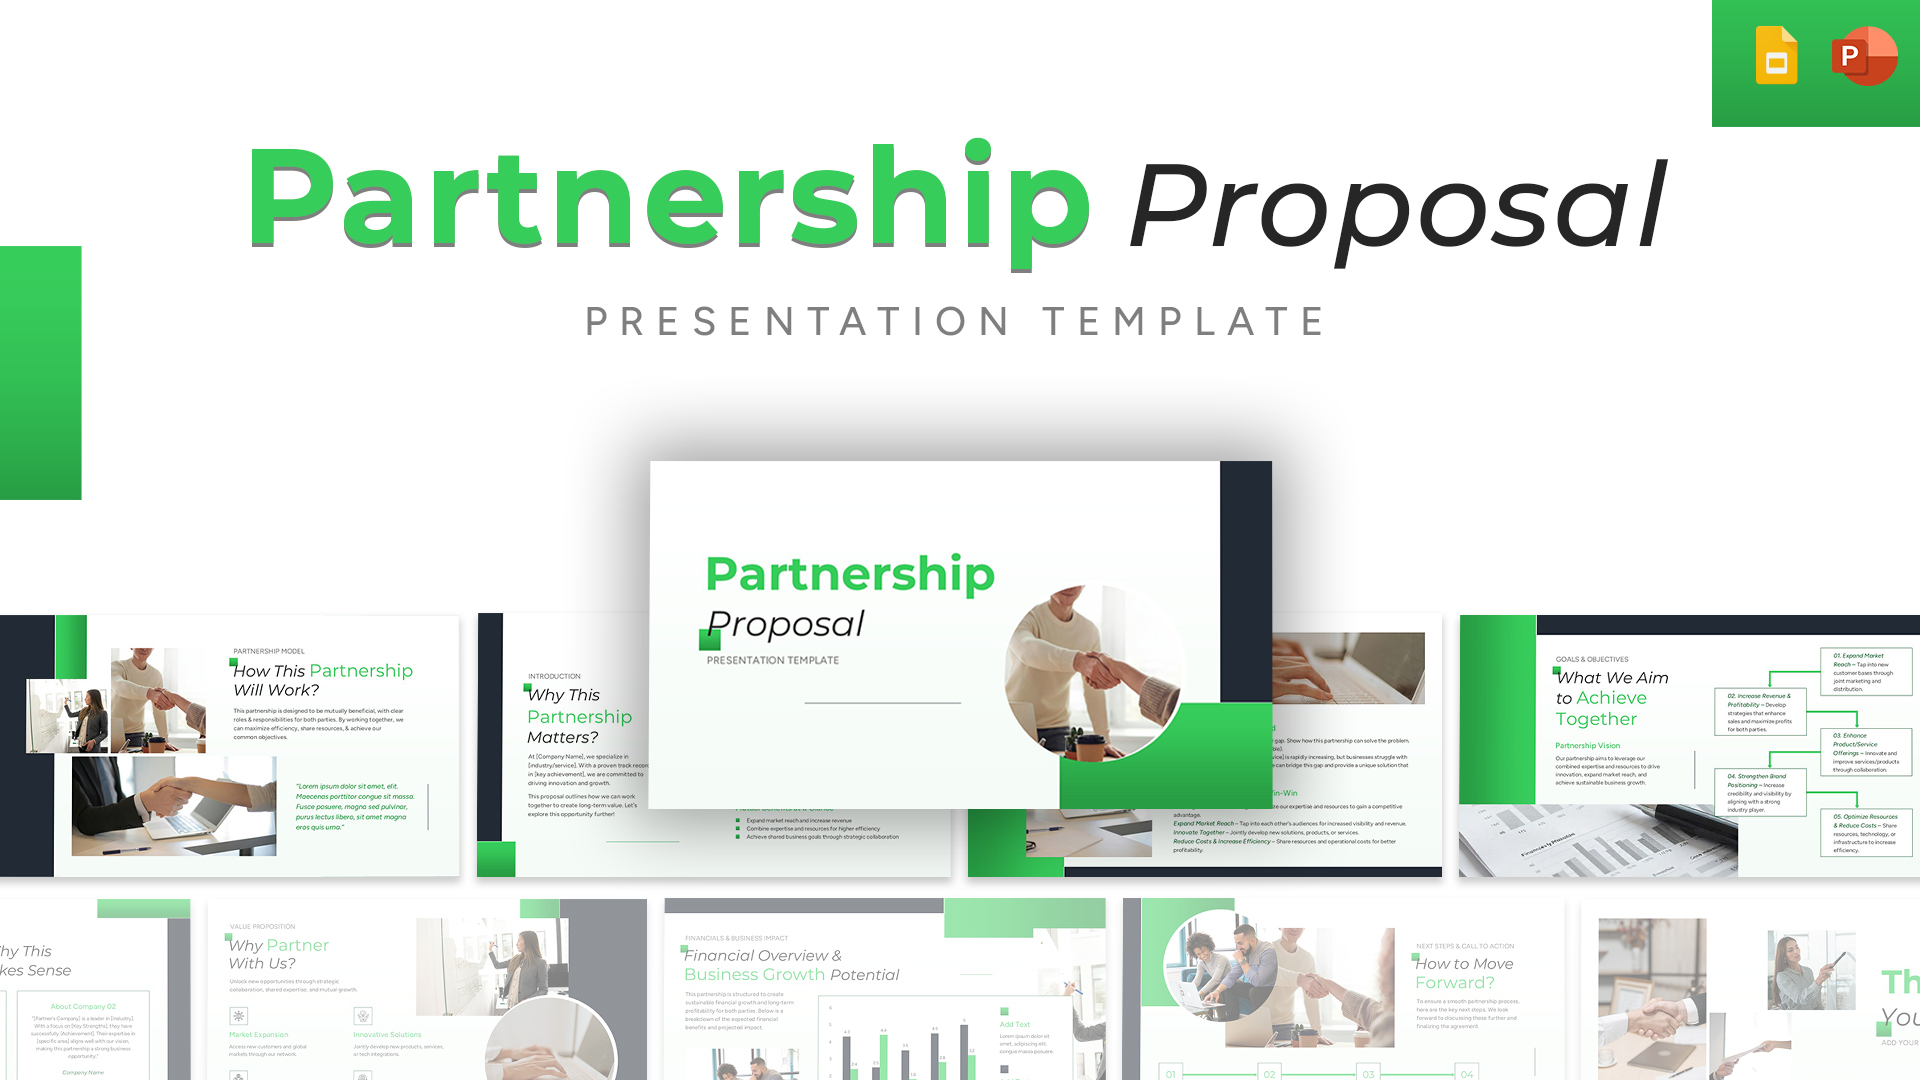
You May Also Like These Presentation Templates


- Free

- Free
- Free
- Free
- Free
- Free