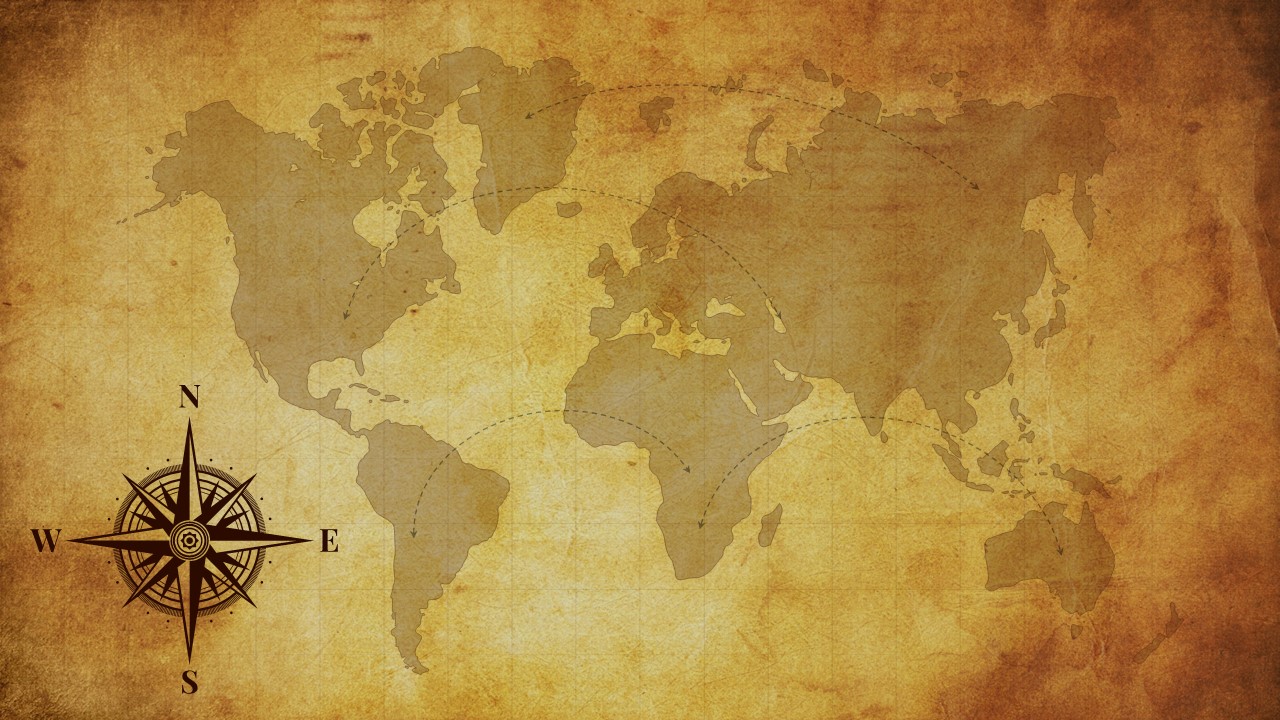
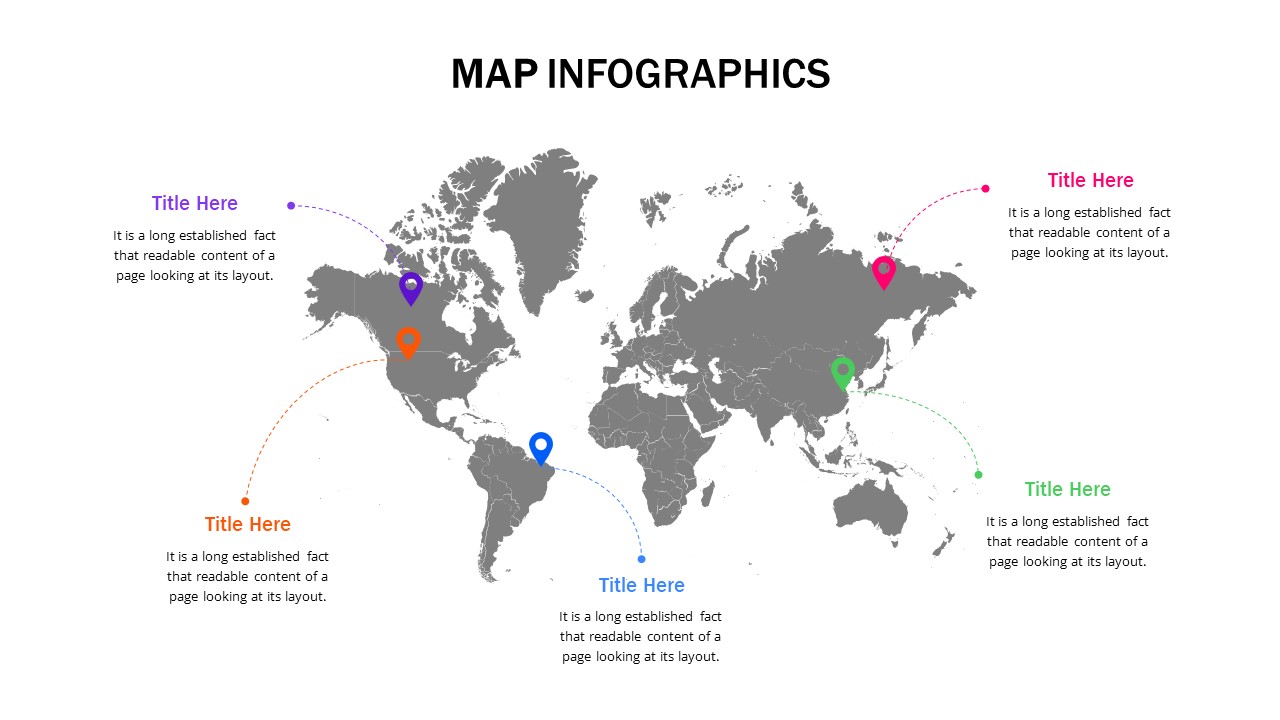
World Map Weather Infographics Template
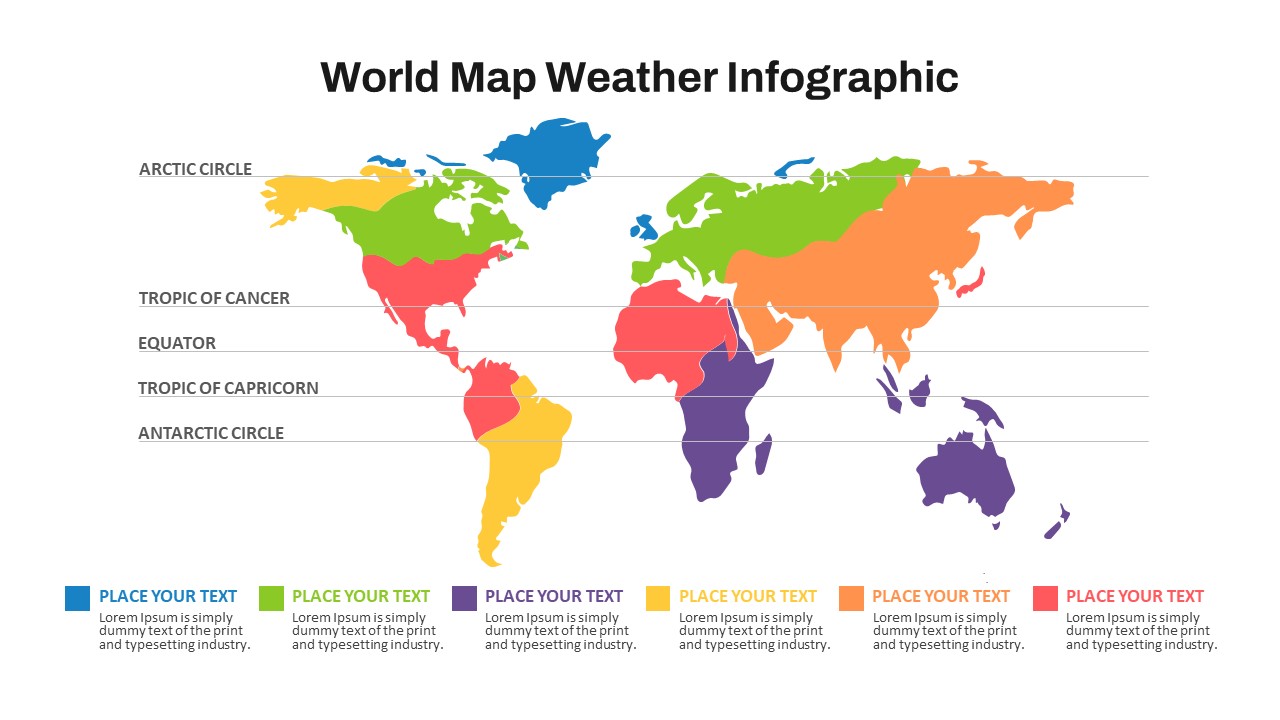

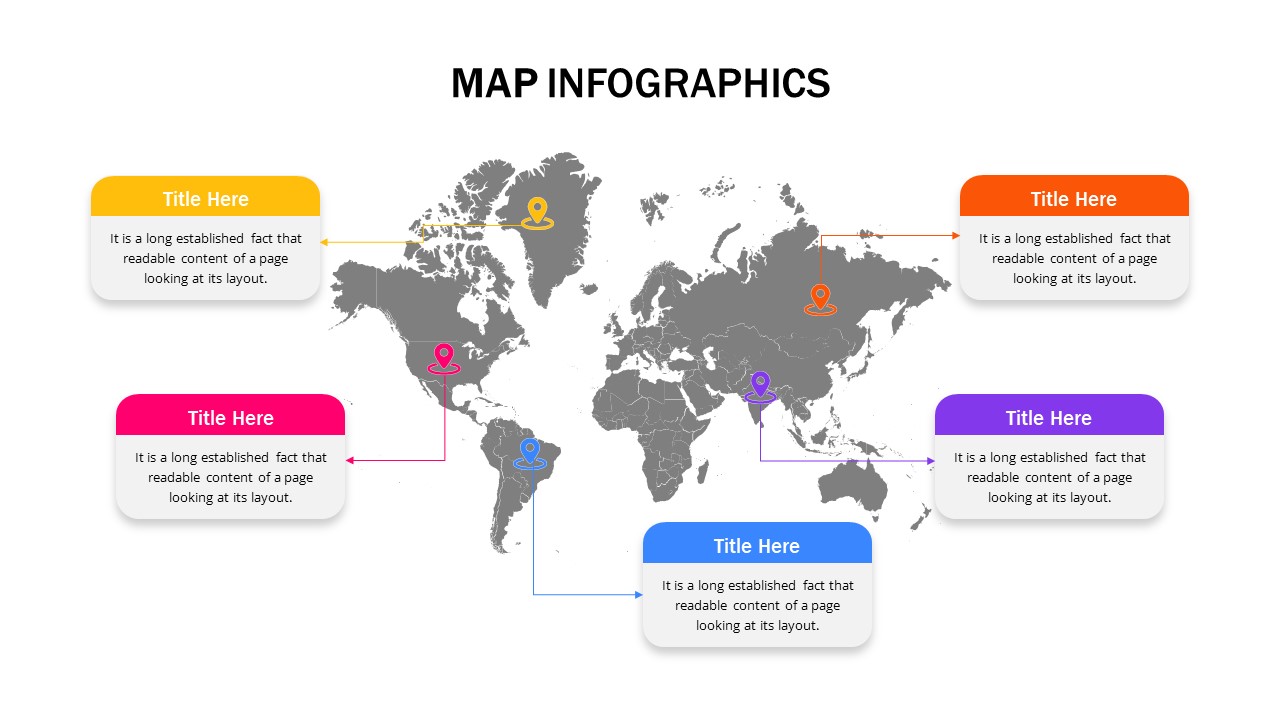
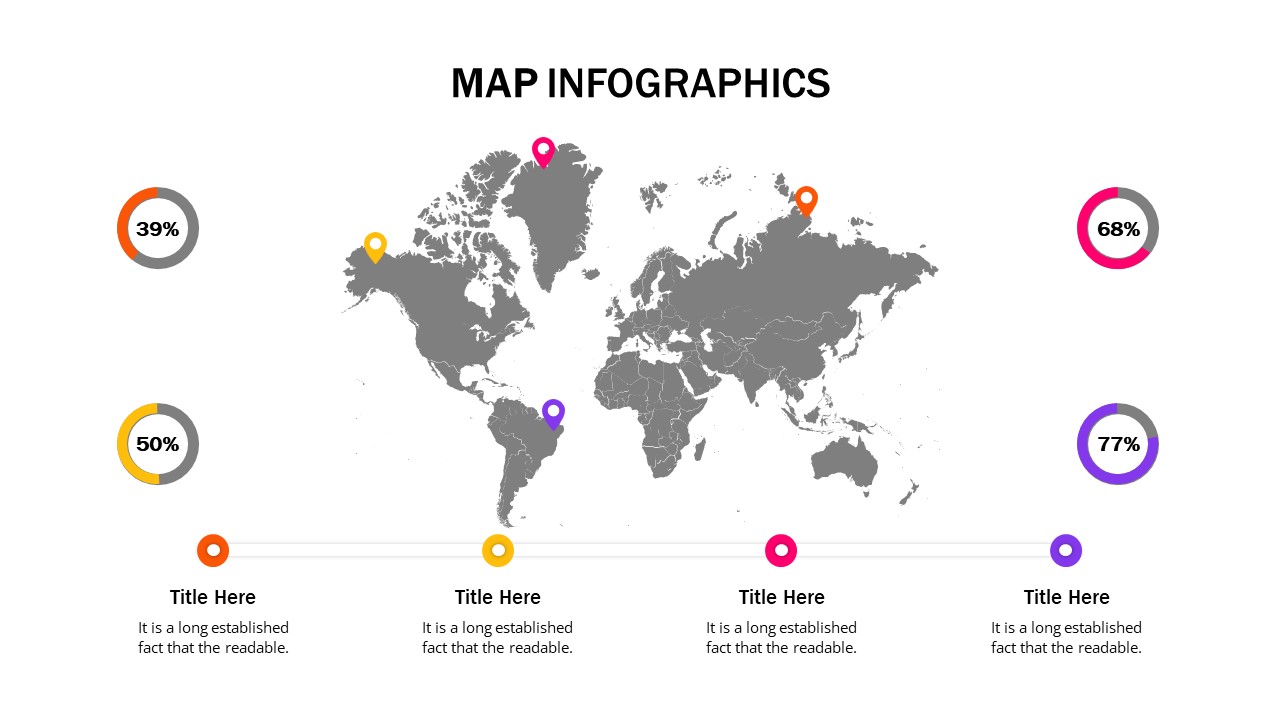
The World Map Weather Infographic Template is a versatile and visually engaging tool designed to display global weather patterns, climate zones, and geographical information. This world map for PowerPoint presentation template features a colorful world map, segmented into distinct climate regions, including the Arctic Circle, Tropic of Cancer, Equator, Tropic of Capricorn, and the Antarctic Circle. Each region is represented by a unique color, making it easy to differentiate and analyze weather data or climatic trends across different parts of the world.
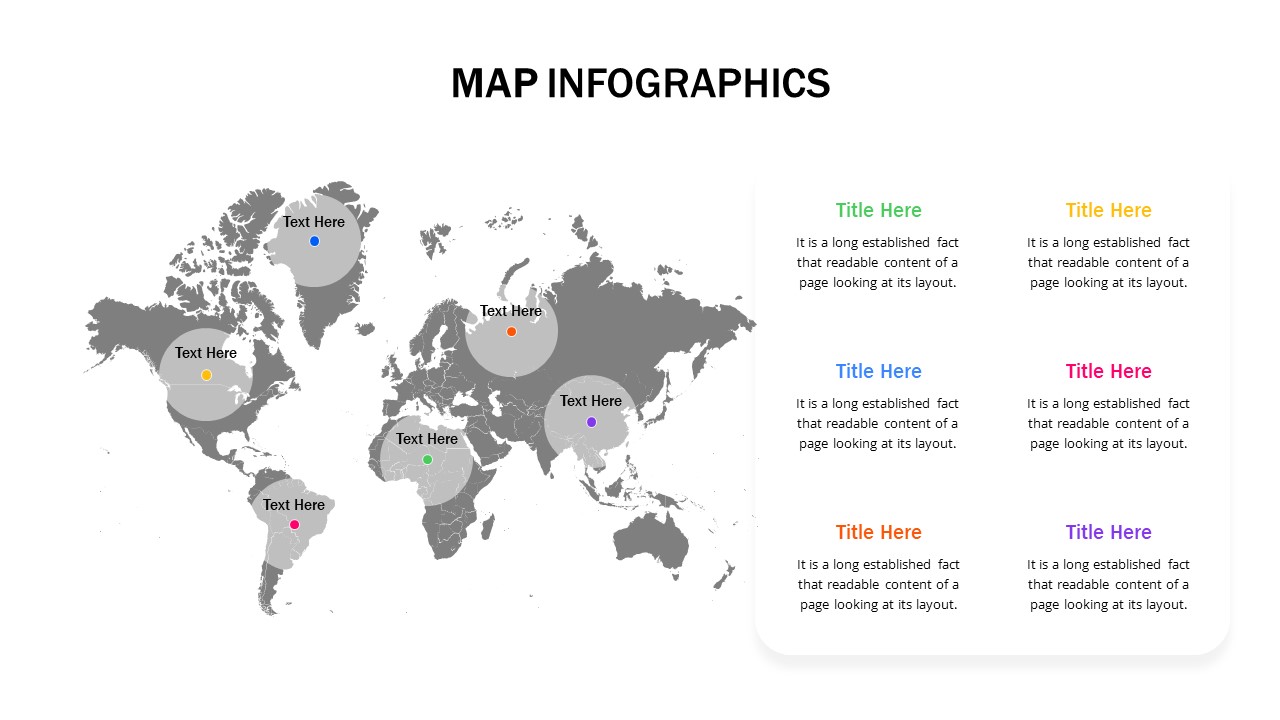
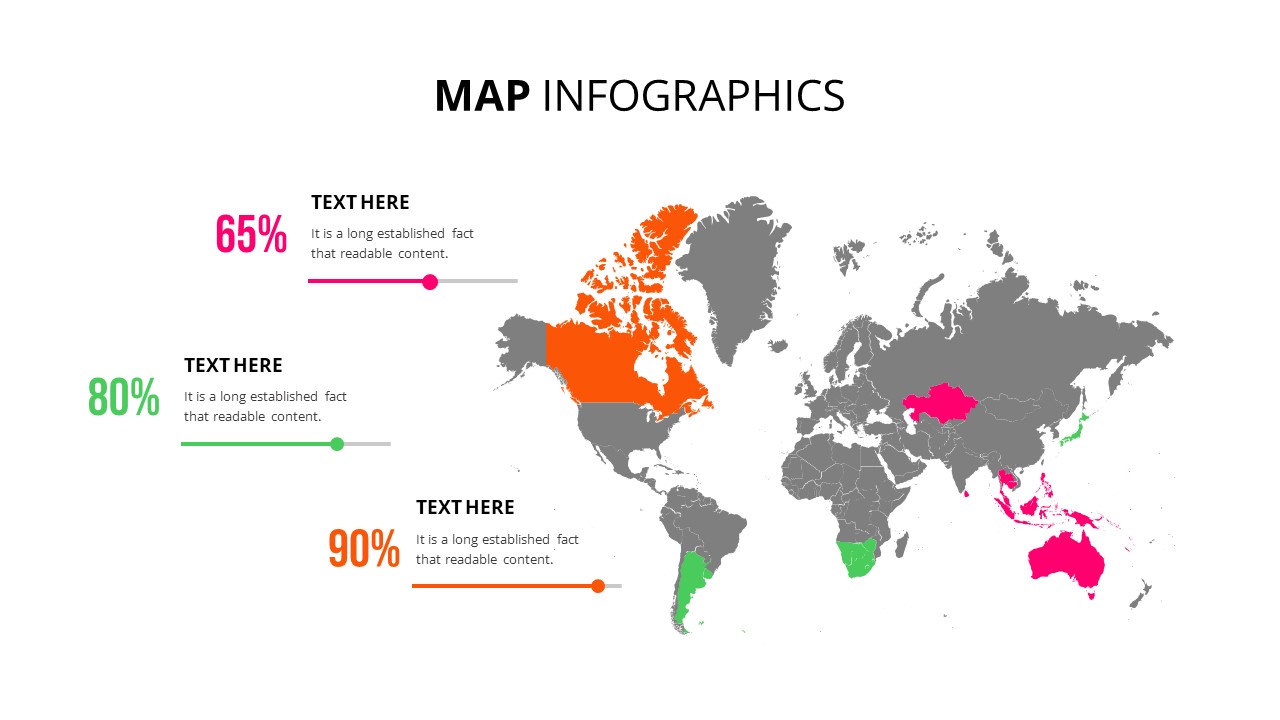
Ideal for meteorologists, educators, geographers, and environmental researchers, this template allows you to present complex weather data in a clear and accessible manner. You can customize each segment of the map with specific information, such as average temperatures, precipitation levels, or other relevant weather data. The template also includes placeholders for descriptive text, enabling you to provide detailed explanations or insights about each climatic region.
In addition to weather analysis, this infographic can be adapted for various educational and professional purposes, such as teaching geography, discussing climate change, or illustrating global environmental patterns. The vibrant design and clear layout ensure that your audience remains engaged, while the customizable features allow you to tailor the presentation to your specific needs.
See more

Aspect Ratio
16:9Item ID
SKT01089
Features of this template
Other User Cases of the Template:
climate change presentations, geography education, environmental science reports, global temperature analysis, climate zone mapping, educational infographics, meteorological research, global environmental patterns, weather forecasting, world geography exploration.
FAQs
You May Also Like These Presentation Templates


- Free
- Free
- Free
- Free


- Free
- Free
- Free
- Free

- Free
- Free
- Free
- Free
- Free
- Free
- Free
- Free
- Free
- Free
- Free
- Free
- Free